Getting Started with Bruin
Most data teams end up with a stack that looks like this:
- Fivetran or Airbyte for data ingestion.
- dbt for SQL transformations.
- Airflow for orchestration.
- Great Expectations for data quality.
This stack works, but it comes with real costs: each tool requires its own configuration files, authentication setup, and learning curve. Airbyte needs connector configurations. dbt needs profiles.yml and dbt_project.yml. Airflow needs DAGs written in Python. Great Expectations needs expectation suites. For a small team or solo developer, this overhead adds days to what should be a simple pipeline.
Bruin consolidates these tools into one. You define data sources, transformations, and quality checks in a single project. Everything runs through one CLI. If you know SQL, you can build a complete pipeline in an afternoon.
In this guide, you'll build an e-commerce analytics pipeline using CSV files and SQL. You'll load raw data, clean and join it, and produce business metrics that answer questions like "What's our daily revenue?" and "Who are our best customers?"
By the end, you'll have four analytics tables:
| Table | Question | Key Metrics |
|---|---|---|
daily_revenue | "How much did we make each day?" | Total revenue, order count, customer count |
product_performance | "Which products sell best?" | Units sold, revenue, ranking |
customer_metrics | "Who are our best customers?" | Total spent, order count, segment |
category_performance | "Which categories drive revenue?" | Category revenue, average order value |
Prerequisites
To follow this guide, you'll need:
The complete working project is available at https://github.com/ritza-co/getting-started-with-bruin.
Our Data pipeline architecture
Before diving into code, understand what you're building. This pipeline follows a medallion architecture, a pattern that organizes data into layers of increasing quality.
Think of it like a factory assembly line: raw materials (CSV files) enter, go through processing stations (cleaning, joining), and emerge as finished products (analytics tables).
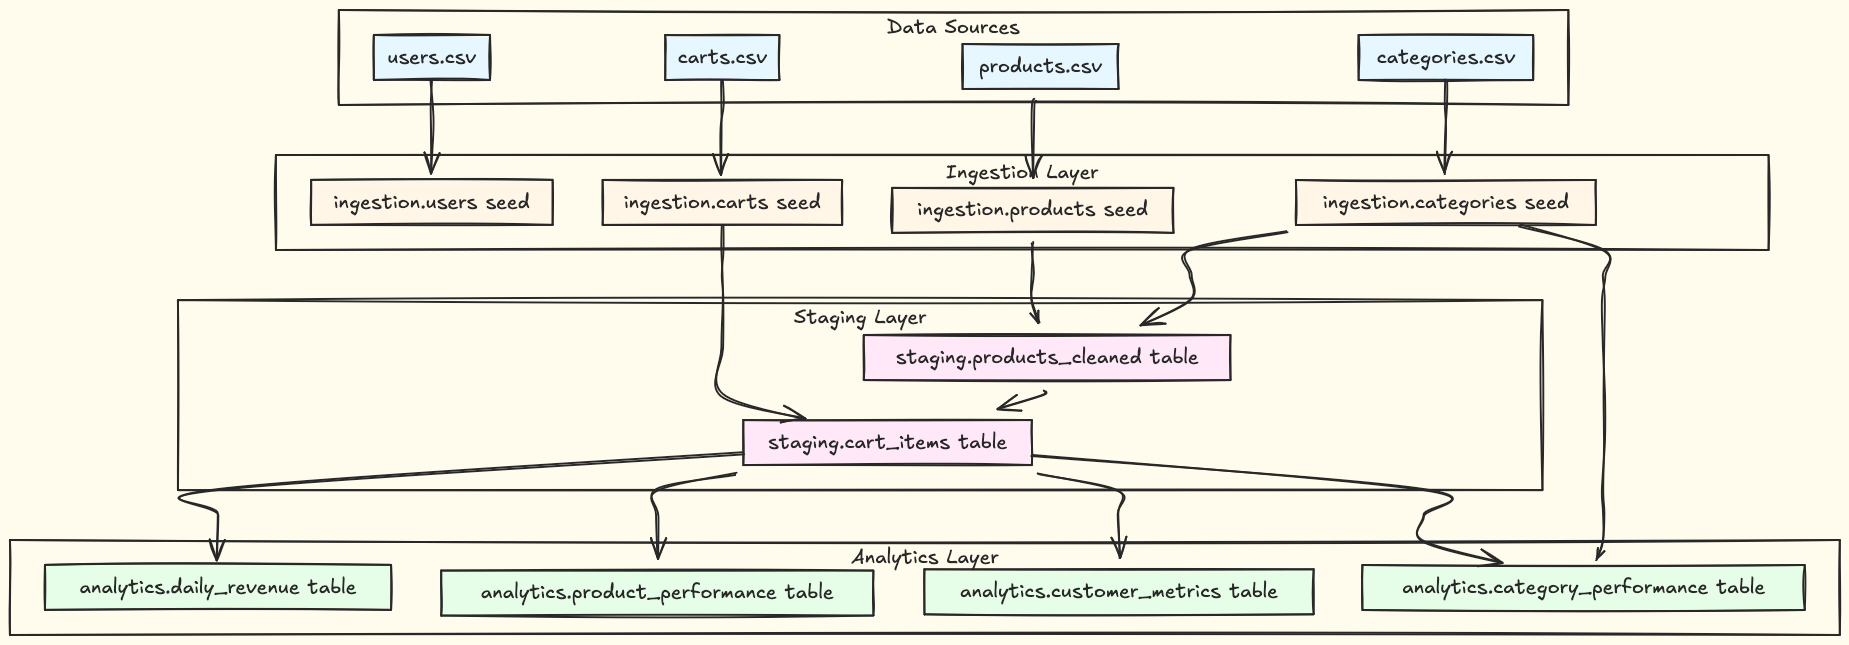
The pipeline has three layers:
-
Ingestion layer: This is where CSV files are loaded into DuckDB as seed assets. You'll apply type definitions and run initial quality checks, such as
not nullanduniqueconstraints. -
Staging layer: This is where data gets cleaned and joined. You'll normalize data by trimming whitespace and fixing casing, filter out invalid records, and join related datasets to create the foundation for analytics.
-
Analytics layer: This is where you aggregate data into meaningful metrics to answer business questions. These tables are optimized for reporting and dashboards.
Bruin Concepts
In Bruin, everything is an asset. An asset is a unit of work that produces data.
You can create three types of assets:
- Seed: Loads CSV files into tables
- SQL: Transforms data with SQL queries
- Python: Handles custom transformations
When you run a SQL asset, you materialize it as either a view or table. A view is a virtual table stored as a SQL query. It's fast to create but slower to query, and always shows fresh results. Use views for lightweight transformations, filtering, and column renaming.
A table stores data on disk. It's fast to query but slower to create and uses storage space. In this guide, you're working with DuckDB, a fast SQL database engine optimized for analytics. Use tables for complex joins, aggregations, and frequently queried data.
Assets declare dependencies using the depends block in YAML:
depends:
  - ingestion.users
  - staging.products_cleaned
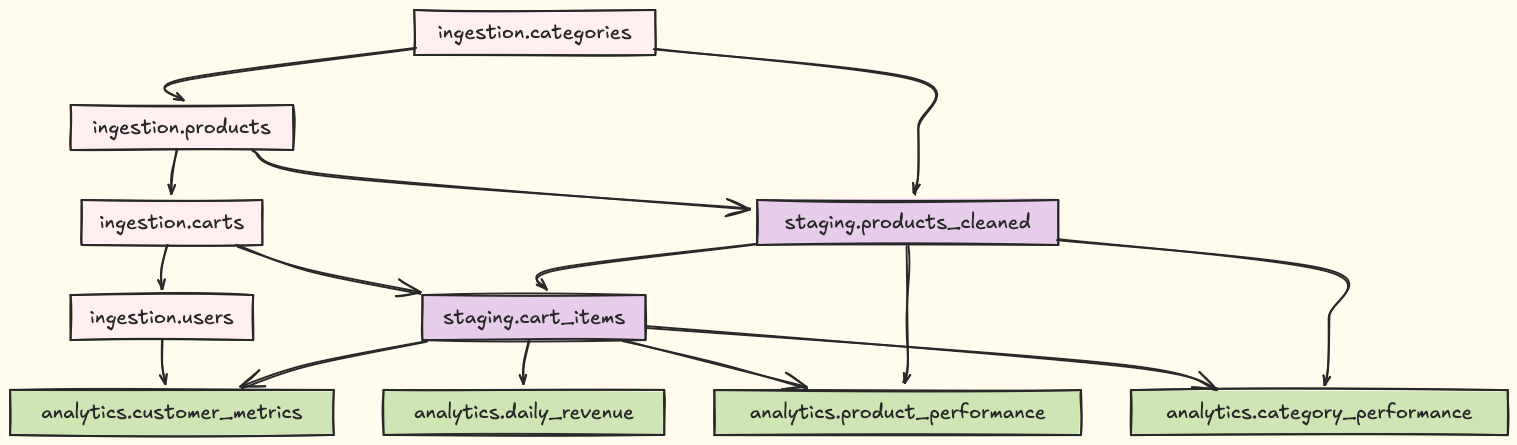
Bruin builds a dependency graph and executes assets in the correct order:
Project Setup
Note: Bruin provides a
bruin initcommand that can scaffold projects from templates. However, this tutorial walks you through creating everything manually so you understand each component. If you prefer to start with a template, you can runbruin init [template-name] [folder-name]and then adapt it to this tutorial's structure.
The project structure for this tutorial will look like this:
bruin-project/
├── assets/
│   ├── ingestion/    # Raw data ingestion
│   ├── staging/      # Data cleaning and transformation
│   └── analytics/    # Business metrics
├── seeds/            # CSV source files
├── docker-compose.yml
└── .bruin.yml        # Pipeline configuration
Run the following command to create the project directory and structure:
mkdir -p bruin-project/{assets/{ingestion,staging,analytics},seeds}
cd bruin-project
Once it's done, create a docker-compose.yaml file in the project root:
services:
  bruin:
    image: ghcr.io/bruin-data/bruin:v0.11.363
    container_name: bruin-pipeline
    working_dir: /workspace
    volumes:
      - .:/workspace
      - ./duckdb.db:/workspace/duckdb.db
      - ./outputs:/workspace/outputs
    environment:
      - BRUIN_ENV=local
    command: tail -f /dev/null
    stdin_open: true
    tty: true
This configuration mounts your local project directory into the container, keeps the container running for interactive use, and sets the default environment.
Start the container:
docker-compose up -d --build
Creating Sample Data
For this tutorial, you'll work with four CSV files. You can find these files in the project repository under seeds/, but they're included here so you can focus on learning Bruin.
seeds/users.csv
user_id,email,signup_date,country
1,alice@example.com,2024-01-15,USA
2,bob@example.com,2024-02-20,UK
3,charlie@example.com,2024-03-10,Canada
4,diana@example.com,2024-03-25,USA
seeds/products.csv
product_id,name,price,category_id
101,Laptop,999.99,1
102,Mouse,29.99,1
103,Keyboard,79.99,1
104,Monitor,299.99,1
105,USB Cable,9.99,2
106,Headphones,149.99,2
seeds/categories.csv
category_id,category_name
1,Electronics
2,Accessories
seeds/carts.csv
cart_id,user_id,product_id,quantity,cart_date
1,1,101,1,2024-04-01
2,1,102,2,2024-04-01
3,2,103,1,2024-04-05
4,3,104,1,2024-04-10
5,3,105,3,2024-04-10
6,4,106,1,2024-04-15
7,1,104,1,2024-04-20
Initializing Bruin pipeline
Bruin allows you to define a YAML configuration file that includes the pipeline name and the environments. We will create a pipeline configuration file to determine the database connection.
name: ecommerce-analytics
default_environment: default

environments:
  default:
    connections:
      duckdb:
        - name: duckdb
          path: duckdb.db
In the configuration above, we are naming the pipeline ecommerce-analytics and defining a DuckDB connection that stores data in duckdb.db.
With the configurations done, we can now move on to building the pipeline.
Building the Pipeline
The pipeline has three layers: ingestion loads raw data, staging cleans and joins it, and analytics produces business metrics. You'll build each layer in order.
Ingestion (Seed Assets)
The first step is ingestion. In Bruin, this means defining seed assets that load raw CSV data into DuckDB.
Seed assets load external data in three steps:
- Read CSV files from the filesystem
- Validate data types and constraints (defined in
columns) - Load into DuckDB tables (using the connection from
.bruin.yml)
Create a file called users.asset.yml in assets/ingestion/:
name: ingestion.users
type: duckdb.seed

depends:
  - ingestion.carts

parameters:
  path: ../../seeds/users.csv

columns:
  - name: user_id
    type: integer
    description: "Unique identifier for users"
    checks:
      - name: not_null
      - name: unique

  - name: email
    type: varchar
    description: "User email address"
    checks:
      - name: not_null

  - name: signup_date
    type: date
    description: "Date when user signed up"

  - name: country
    type: varchar
    description: "User's country"
This configuration defines several things:
name: The asset identifier (ingestion.users)type: duckdb.seed: Tells Bruin to use DuckDB's CSV reading capabilitiesdepends: Ensures sequential execution to avoid DuckDB concurrency issuescolumns: Defines data types and quality checks likenot_nullandunique
The connection to DuckDB is implicit for seed assets and uses the connection defined in .bruin.yml.
Now define the remaining ingestion assets.
assets/ingestion/categories.asset.yml (no dependencies, runs first)
name: ingestion.categories
type: duckdb.seed

parameters:
  path: ../../seeds/categories.csv

columns:
  - name: category_id
    type: integer
    description: "Unique identifier for categories"
    checks:
      - name: not_null
      - name: unique

  - name: category_name
    type: varchar
    description: "Category name"
    checks:
      - name: not_null
assets/ingestion/products.asset.yml (depends on categories)
name: ingestion.products
type: duckdb.seed

depends:
  - ingestion.categories

parameters:
  path: ../../seeds/products.csv

columns:
  - name: product_id
    type: integer
    description: "Unique identifier for products"
    checks:
      - name: not_null
      - name: unique

  - name: name
    type: varchar
    description: "Product name"
    checks:
      - name: not_null

  - name: price
    type: double
    description: "Product price"
    checks:
      - name: not_null
      - name: positive

  - name: category_id
    type: integer
    description: "Category ID"
    checks:
      - name: not_null
assets/ingestion/carts.asset.yml (depends on products)
name: ingestion.carts
type: duckdb.seed

depends:
  - ingestion.products

parameters:
  path: ../../seeds/carts.csv

columns:
  - name: cart_id
    type: integer
    description: "Unique cart transaction ID"
    checks:
      - name: not_null
      - name: unique

  - name: user_id
    type: integer
    description: "User ID"
    checks:
      - name: not_null

  - name: product_id
    type: integer
    description: "Product ID"
    checks:
      - name: not_null

  - name: quantity
    type: integer
    description: "Quantity purchased"
    checks:
      - name: not_null
      - name: positive

  - name: cart_date
    type: date
    description: "Date of transaction"
    checks:
      - name: not_null
Staging (Data Cleaning)
This is the Transform phase of ETL, where you clean, normalize, and join data to prepare it for analytics. In Bruin, you use SQL assets with the duckdb.sql type.
SQL assets work in three steps:
- Read from source tables (defined in
depends) - Transform using SQL queries (your business logic)
- Write to destination tables or views (defined in
materialization)
Create products_cleaned.sql in assets/staging/:
/* @bruin
name: staging.products_cleaned
type: duckdb.sql
connection: duckdb

materialization:
  type: table
  schema: staging
  table: products_cleaned

depends:
  - ingestion.products
  - ingestion.categories
@bruin */

-- Staging: Clean and validate product data
-- Input: ingestion.products, ingestion.categories
-- Output: staging.products_cleaned
-- Purpose: Join products with categories, validate data, calculate final prices

SELECT
    p.product_id,
    p.name AS product_name,
    p.price,
    c.category_id,
    c.category_name,
    p.price AS base_price
FROM ingestion.products p
LEFT JOIN ingestion.categories c ON p.category_id = c.category_id
WHERE
    p.price > 0
    AND p.name IS NOT NULL
    AND p.product_id IS NOT NULL
This asset depends on the ingestion of products and categories. Bruin uses these dependencies to determine execution order.
Create cart_items.sql in assets/staging/:
/* @bruin
name: staging.cart_items
type: duckdb.sql
connection: duckdb-default

materialization:
  type: table
  schema: staging
  table: cart_items

depends:
  - ingestion.carts
  - staging.products_cleaned
@bruin */

-- Staging: Create cart items with product details
-- Input: ingestion.carts, staging.products_cleaned
-- Output: staging.cart_items
-- Purpose: Join carts with products to create detailed line items

SELECT
    c.cart_id,
    c.user_id,
    c.product_id,
    c.quantity,
    c.cart_date,
    p.product_name,
    p.category_name,
    p.base_price AS unit_price,
    c.quantity * p.base_price AS line_total
FROM ingestion.carts c
LEFT JOIN staging.products_cleaned p ON c.product_id = p.product_id
WHERE
    c.quantity > 0
    AND p.product_id IS NOT NULL
Analytics (Business Metrics)
This is the Load phase of ETL, where you create final, business-ready datasets optimized for reporting. These analytics tables answer the business questions you defined at the start.
At this phase, you:
- Aggregate data (daily totals, averages, counts)
- Apply business logic (revenue calculations, customer segments)
- Structure data for fast queries and reporting
- Create tables that answer business questions
You'll create four analytics tables:
daily_revenue: Aggregates sales by dayproduct_performance: Ranks products by salescustomer_metrics: Segments customers by valuecategory_performance: Analyzes category-level metrics
Analytics assets are SQL assets (same as staging) but focus on metrics and insights rather than data cleaning.
Create daily_revenue.sql in assets/analytics/:
/* @bruin
name: analytics.daily_revenue
type: duckdb.sql
connection: duckdb-default

materialization:
  type: table
  schema: analytics
  table: daily_revenue

depends:
  - staging.cart_items
@bruin */

-- Analytics: Daily Revenue Summary
-- Input: staging.cart_items
-- Output: analytics.daily_revenue
-- Purpose: Calculate daily revenue metrics for business reporting

SELECT
    cart_date AS report_date,
    SUM(line_total) AS total_revenue,
    COUNT(DISTINCT cart_id) AS num_orders,
    COUNT(DISTINCT user_id) AS num_customers,
    SUM(quantity) AS total_items_sold,
    AVG(line_total) AS avg_order_value,
    COUNT(*) AS total_line_items
FROM staging.cart_items
GROUP BY cart_date
ORDER BY cart_date DESC
This uses a separate analytics schema to organize your data warehouse. The materialization block specifies the schema and table name for the output.
Create the remaining analytics assets.
assets/analytics/product_performance.sql
/* @bruin
name: analytics.product_performance
type: duckdb.sql
connection: duckdb-default

materialization:
  type: table
  schema: analytics
  table: product_performance

depends:
  - staging.cart_items
  - staging.products_cleaned
@bruin */

-- Analytics: Product Performance Metrics
-- Input: staging.cart_items, staging.products_cleaned
-- Output: analytics.product_performance
-- Purpose: Analyze product sales performance and rankings

SELECT
    p.product_id,
    p.product_name,
    p.category_name,
    p.base_price AS current_price,
    COUNT(DISTINCT ci.cart_id) AS times_purchased,
    COALESCE(SUM(ci.quantity), 0) AS total_units_sold,
    COALESCE(SUM(ci.line_total), 0) AS total_revenue,
    RANK() OVER (ORDER BY COALESCE(SUM(ci.line_total), 0) DESC) AS revenue_rank,
    CASE
        WHEN COALESCE(SUM(ci.quantity), 0) > 0
        THEN COALESCE(SUM(ci.line_total), 0) / SUM(ci.quantity)
        ELSE 0
    END AS avg_unit_price
FROM staging.products_cleaned p
LEFT JOIN staging.cart_items ci ON p.product_id = ci.product_id
GROUP BY
    p.product_id,
    p.product_name,
    p.category_name,
    p.base_price
ORDER BY total_revenue DESC
assets/analytics/customer_metrics.sql
/* @bruin
name: analytics.customer_metrics
type: duckdb.sql
connection: duckdb-default

materialization:
  type: table
  schema: analytics
  table: customer_metrics

depends:
  - staging.cart_items
  - ingestion.users
@bruin */

-- Analytics: Customer Metrics and Segmentation
-- Input: staging.cart_items, ingestion.users
-- Output: analytics.customer_metrics
-- Purpose: Calculate customer lifetime value and segment customers

SELECT
    u.user_id,
    u.email,
    u.country,
    COUNT(DISTINCT ci.cart_id) AS total_orders,
    COALESCE(SUM(ci.line_total), 0) AS total_spent,
    CASE
        WHEN COUNT(DISTINCT ci.cart_id) > 0
        THEN COALESCE(SUM(ci.line_total), 0) / COUNT(DISTINCT ci.cart_id)
        ELSE 0
    END AS avg_order_value,
    COALESCE(SUM(ci.quantity), 0) AS total_items_purchased,
    CASE
        WHEN COALESCE(SUM(ci.line_total), 0) > 1000 THEN 'High Value'
        WHEN COALESCE(SUM(ci.line_total), 0) > 500 THEN 'Medium Value'
        WHEN COALESCE(SUM(ci.line_total), 0) > 0 THEN 'Low Value'
        ELSE 'No Purchase'
    END AS customer_segment,
    MIN(ci.line_total) AS min_order_value,
    MAX(ci.line_total) AS max_order_value
FROM ingestion.users u
LEFT JOIN staging.cart_items ci ON u.user_id = ci.user_id
GROUP BY
    u.user_id,
    u.email,
    u.country
ORDER BY total_spent DESC
assets/analytics/category_performance.sql
/* @bruin
name: analytics.category_performance
type: duckdb.sql
connection: duckdb-default

materialization:
  type: table
  schema: analytics
  table: category_performance

depends:
  - staging.cart_items
  - staging.products_cleaned
@bruin */

-- Analytics: Category Performance Analysis
-- Input: staging.cart_items, staging.products_cleaned
-- Output: analytics.category_performance
-- Purpose: Analyze sales performance by product category

SELECT
    p.category_name,
    COUNT(DISTINCT p.product_id) AS num_products,
    COUNT(DISTINCT ci.cart_id) AS num_orders,
    COALESCE(SUM(ci.quantity), 0) AS total_units_sold,
    COALESCE(SUM(ci.line_total), 0) AS total_revenue,
    CASE
        WHEN COUNT(DISTINCT ci.cart_id) > 0
        THEN COALESCE(SUM(ci.line_total), 0) / COUNT(DISTINCT ci.cart_id)
        ELSE 0
    END AS avg_order_value,
    CASE
        WHEN COUNT(DISTINCT p.product_id) > 0
        THEN COALESCE(SUM(ci.line_total), 0) / COUNT(DISTINCT p.product_id)
        ELSE 0
    END AS revenue_per_product,
    COUNT(DISTINCT ci.user_id) AS unique_customers
FROM staging.products_cleaned p
LEFT JOIN staging.cart_items ci ON p.product_id = ci.product_id
GROUP BY p.category_name
ORDER BY total_revenue DESC
Running the Pipeline
Now comes the exciting part: watching your pipeline come to life. You'll validate, visualize, and execute the entire data transformation process.
Step 1: Validate Configuration
Before running anything, make sure your pipeline is correctly configured. This checks for syntax errors and configuration issues.
docker exec bruin-pipeline bruin validate .
Expected output:
✓ Successfully validated 9 assets across 1 pipeline
Step 2: Visualize the Pipeline
Bruin generates automatic lineage diagrams showing how data flows through your pipeline:
docker exec bruin-pipeline bruin lineage . -o lineage.html
Step 3: Run the Pipeline
Execute the entire pipeline from start to finish:
docker exec bruin-pipeline bruin run .
You'll see a detailed execution log:
[2025-11-20 02:00:00] Starting pipeline: ecommerce-analytics
[2025-11-20 02:00:00] Running: ingestion.users
[2025-11-20 02:00:01] ✓ Completed: ingestion.users (4 rows)
[2025-11-20 02:00:01] Running: ingestion.carts
[2025-11-20 02:00:02] ✓ Completed: ingestion.carts (7 rows)
[2025-11-20 02:00:02] Running: ingestion.products
[2025-11-20 02:00:03] ✓ Completed: ingestion.products (6 rows)
[2025-11-20 02:00:03] Running: ingestion.categories
[2025-11-20 02:00:04] ✓ Completed: ingestion.categories (2 rows)
[2025-11-20 02:00:04] Running: staging.products_cleaned
[2025-11-20 02:00:06] ✓ Completed: staging.products_cleaned
[2025-11-20 02:00:06] Running: staging.cart_items
[2025-11-20 02:00:07] ✓ Completed: staging.cart_items (7 rows)
[2025-11-20 02:00:07] Running: analytics.daily_revenue
[2025-11-20 02:00:08] ✓ Completed: analytics.daily_revenue
[2025-11-20 02:00:08] Running: analytics.product_performance
[2025-11-20 02:00:09] ✓ Completed: analytics.product_performance
[2025-11-20 02:00:09] Running: analytics.customer_metrics
[2025-11-20 02:00:10] ✓ Completed: analytics.customer_metrics
[2025-11-20 02:00:10] Running: analytics.category_performance
[2025-11-20 02:00:11] ✓ Completed: analytics.category_performance

Pipeline completed successfully in 11.2 seconds
✓ 9 assets executed
✓ 0 failures
Step 4: Query the Results
You can query the data in two ways.
Method 1: Quick Queries via Docker
The fastest way to see results is using Bruin's built-in query command.
View daily revenue trends:
docker exec bruin-pipeline bruin query "SELECT * FROM analytics.daily_revenue"
Sample output:
┌────────────┬───────────────┬──────────────┬─────────────┬──────────────────┐
│    date    │ total_revenue │ total_orders │ total_items │ avg_order_value │
├────────────┼───────────────┼──────────────┼─────────────┼──────────────────┤
│ 2024-04-01 │      1059.97  │      2       │      3      │      529.99      │
│ 2024-04-05 │        79.99  │      1       │      1      │       79.99      │
│ 2024-04-10 │       329.96  │      2       │      4      │      164.98      │
│ 2024-04-15 │       149.99  │      1       │      1      │      149.99      │
│ 2024-04-20 │       299.99  │      1       │      1      │      299.99      │
└────────────┴───────────────┴──────────────┴─────────────┴──────────────────┘
Check top-performing products:
docker exec bruin-pipeline bruin query "
SELECT
    product_name,
    total_units_sold,
    total_revenue
FROM analytics.product_performance
ORDER BY total_revenue DESC
LIMIT 5"
Analyze customer behavior:
docker exec bruin-pipeline bruin query "
SELECT
    email,
    total_orders,
    total_spent,
    ROUND(avg_order_value, 2) as avg_order
FROM analytics.customer_metrics
ORDER BY total_spent DESC"
View category performance:
docker exec bruin-pipeline bruin query "
SELECT * FROM analytics.category_performance"
Method 2: Interactive DuckDB CLI
For deeper exploration, connect directly to the DuckDB database:
# Enter the container
docker exec -it bruin-pipeline bash

# Open DuckDB CLI
duckdb duckdb.db
Now you're in an interactive SQL shell. List all tables:
SHOW TABLES;
Describe a table structure:
DESCRIBE analytics.daily_revenue;
Conclusion
You've built a complete data pipeline from CSV files to business analytics using Bruin. The pipeline loads raw data, cleans and joins it, and produces metrics that answer specific business questions.
Bruin consolidates what would typically require four separate tools (Airbyte, dbt, Airflow, Great Expectations) into one. You define everything in SQL and YAML, run it with a single CLI command, and get built-in quality checks and lineage visualization.
This approach works well for small to medium datasets where you want fast iteration without the overhead of configuring multiple tools. The entire pipeline runs in Docker, making it portable and easy to version control.
To learn more, check the official Bruin documentation. For production deployments and cloud hosting, Bruin offers managed services.