We Tried Different Ways to Give Claude Code Access to a Web Browser
At Ritza, we build proof-of-concept applications for clients when documenting their products. AI coding agents handle simple projects well, registration pages, login flows, and to-do apps take minutes. But our clients like full MVPs that showcase what their product can do.
An AI coding agent will tell you, "Perfect! The application is ready to test now," when the UI is broken or features don't function. We needed a way for Claude Code, our favorite coding agent, to test its own work before declaring the task done.
We tested two browser automation approaches: dev-browser (a Playwright-based skill) and Claude Code's official Chrome extension. We built the same documentation builder app twice, tracked token usage, and measured completion time for identical tasks.
Dev-browser used an average 33% fewer tokens and finished complex workflows in half the time. Here's what we learned.
Test methodology
We tested both tools with identical tasks using the same prompts in separate Claude Code sessions to prevent context carryover. Each test started fresh with no prior context to ensure fair comparison.
We tracked token usage using ccusage and manual tracking, and measured the time for each task completion. Our measurements have a margin of error of 7-10%, but the performance differences between tools are large enough that this margin doesn't affect our conclusions.
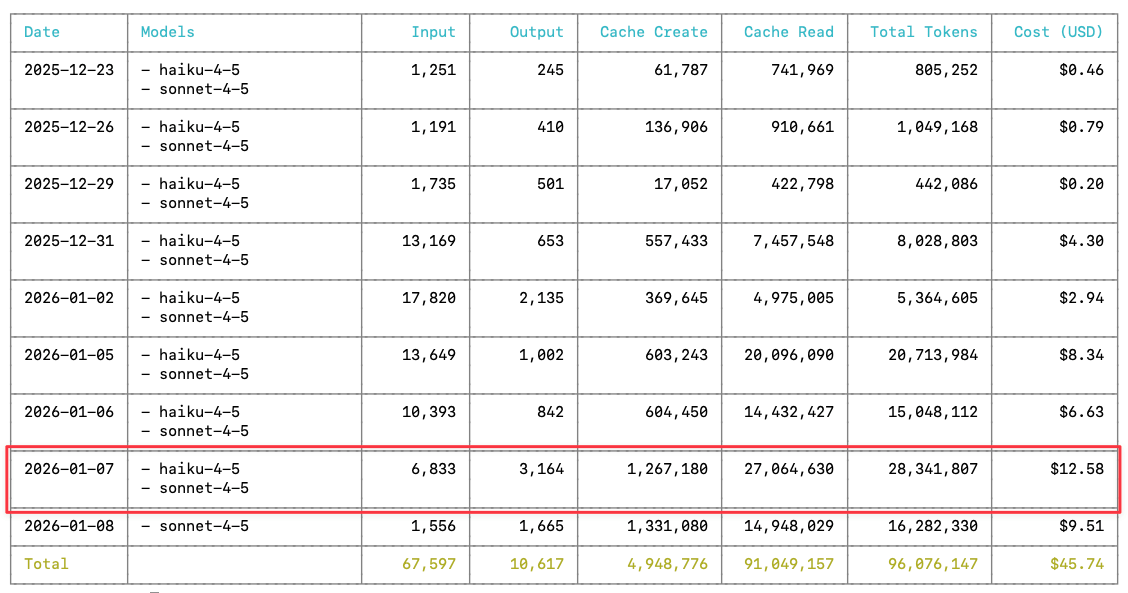
Note: The token counts reported in this article (13k, 8k, 22k, 45k) reflect the visible token usage shown in Claude Code's interface. However, the actual API costs are higher because Claude Code performs additional work behind the scenes, cache reads, cache writes, and other operations not displayed in the UI. For reference, a typical day of building this documentation app, and testing with both tools consumed approximately 28 million tokens (including cache operations) at a cost of $12.58, as shown in our API usage logs.
We tested three scenarios:
- Simple task: Authentication flow with signup, login, and logout (5-10 actions)
- Medium task: Documentation creation with markdown rendering and UI fixes (15-25 actions)
- Complex task: End-to-end workflow from account creation through publishing (30+ actions)
All tests used Claude Sonnet 4.5 and ran on the same machine to eliminate hardware variables.
Setup
If you want to set up dev-browser, read this article. For the Chrome extension, read this article.
Testing authentication
We asked Claude Code to test the signup, login, and logout paths.
The Chrome extension took 15 minutes and consumed 13,000 tokens. Dev-browser consumed 8,000 tokens, 38% fewer because Playwright scripts generate more compact outputs than the Chrome extension's tool call responses.
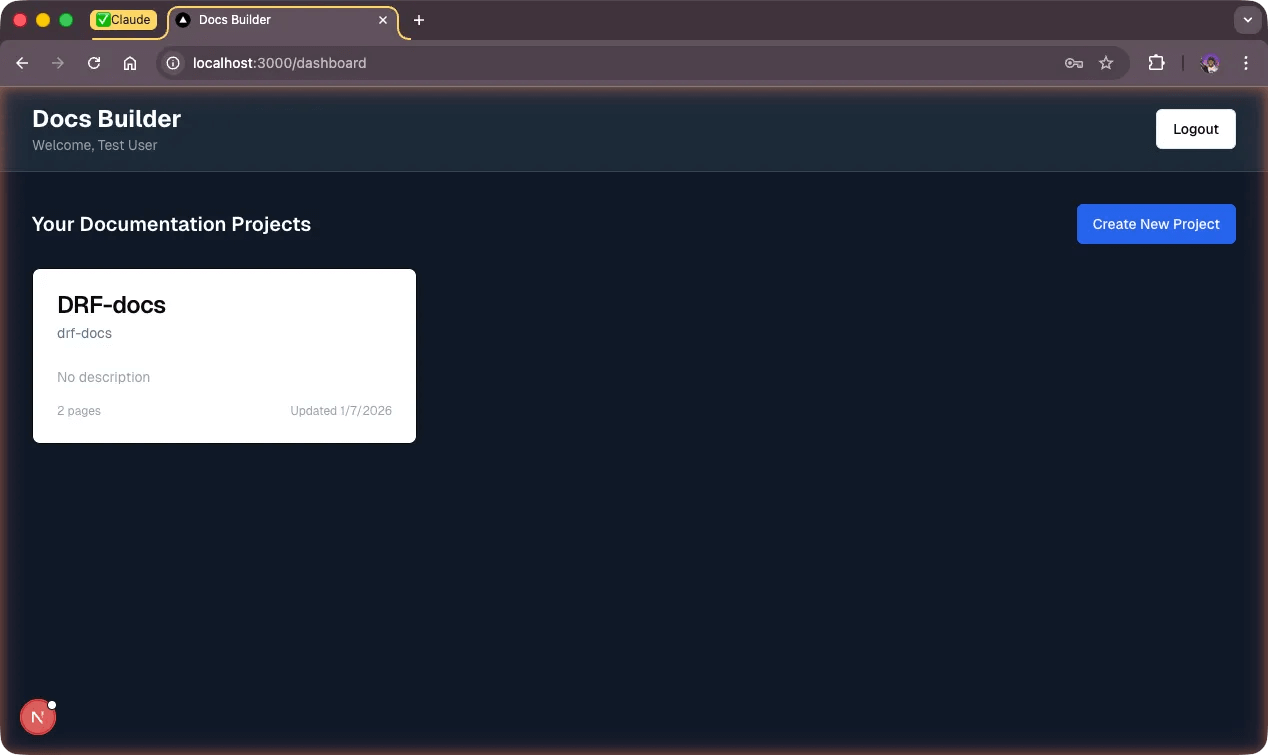
Both tools produced ugly UIs. The documentation list was cramped and unreadable:
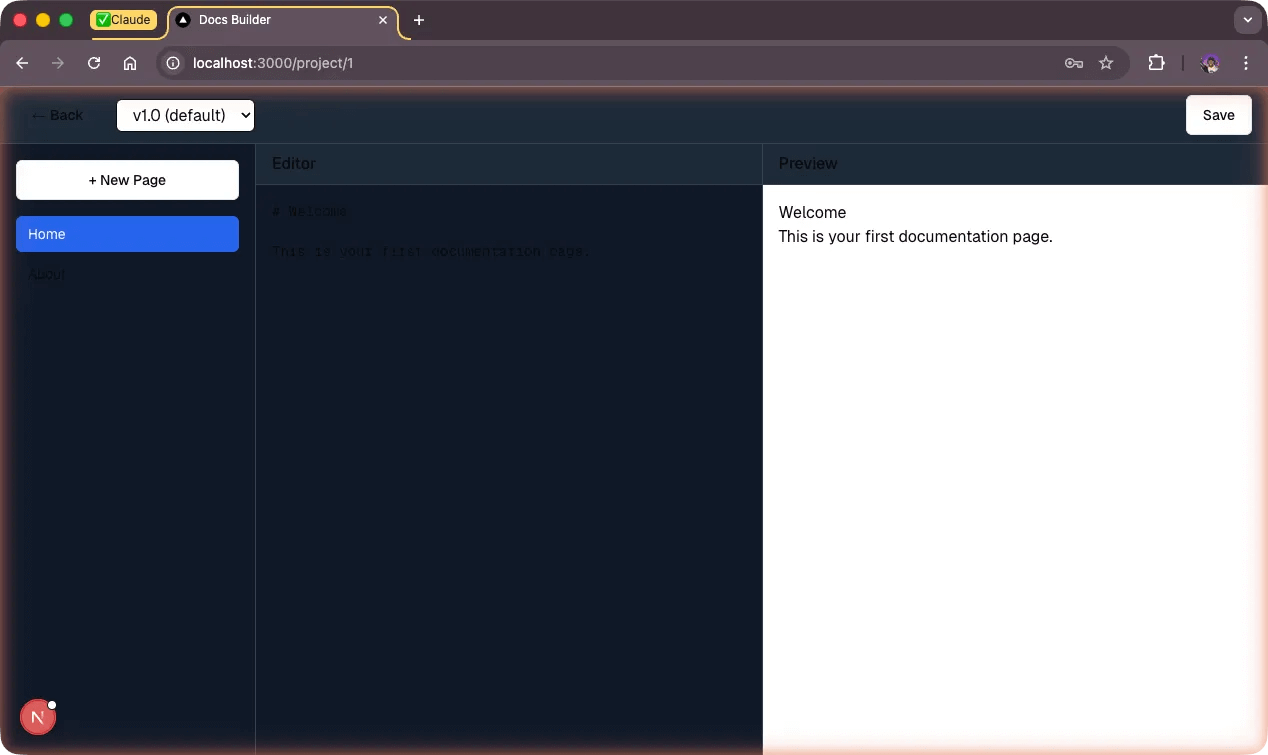
The detail view was worse:
Testing documentation creation
We asked Claude to create a documentation project, add pages, preview markdown rendering, and publish it. The documentation topic: how to build a documentation website using our docs-builder. We also required high color accessibility with black and white only.
Dev-browser took 12 minutes and consumed around 22,000 tokens. The Chrome extension consumed around 45,000 tokens across multiple iterations, twice as many, and the operation took 20 minutes. Dev-browser's visual feedback was better, though we can't pinpoint why.
Both tools caught a critical bug: the publish feature wasn't implemented on the frontend. Claude only checked the API endpoint. The first version looked like this:
What both tools caught
Both tools identified the same typography bug: headings rendered at 16px with no bold weight. Dev-browser diagnosed this via await page.screenshot({ path: "tmp/debug.png" }). Developer tools inspection showed fontSize: 16px, fontWeight: 400 on H1 elements.
Fixing the typography
We asked Claude to visit the rendered pages and verify the UI. We ran two sessions to compare visual feedback speed between the tools.
Claude installed these packages for markdown rendering:
| Package | Purpose |
|---|---|
| react-markdown | Core markdown-to-React rendering |
| remark-gfm | GitHub Flavored Markdown support (tables, task lists, strikethrough) |
| rehype-highlight | Syntax highlighting for code blocks |
| highlight.js | CSS themes for code syntax coloring |
Integration in Next.js:
import ReactMarkdown from 'react-markdown';
import remarkGfm from 'remark-gfm';
import rehypeHighlight from 'rehype-highlight';
import 'highlight.js/styles/github-dark.css';

<ReactMarkdown
  remarkPlugins={[remarkGfm]}
  rehypePlugins={[rehypeHighlight]}
>
  {selectedPage.content}
</ReactMarkdown>
Claude also added 95 lines of custom CSS typography rules to app/globals.css after discovering Tailwind's Typography plugin was incompatible with Tailwind v4's new syntax system.
Testing the complete workflow
Testing features independently works for QA validation. Each feature gets validated like a JIRA or Trello task. But scenario testing validates the complete workflow.
We ran the final test: create an account, create documentation for using the docs builder, and verify the published result. We used dev-browser and the Chrome extension in separate sessions.
The Chrome extension took 32 minutes from signup to writing, viewing, and publishing the documentation. Dev-browser took 15 minutes for the same workflow, less than half the time.
Why dev-browser is faster
Dev-browser uses Playwright with a persistent browser context. Scripts are written in TypeScript and executed via npx tsx:
cd skills/dev-browser && npx tsx <<'EOF'
import { connect, waitForPageLoad } from "@/client.js";

const client = await connect();
const page = await client.page("docs-builder");
await page.goto("http://localhost:3001");
// automation code
await client.disconnect();
EOF
The Chrome extension uses MCP (Model Context Protocol) tools. Each action requires an explicit tool call:
mcp__claude-in-chrome__navigate(tabId, url)
mcp__claude-in-chrome__computer(action: "left_click", coordinate: [x, y])
mcp__claude-in-chrome__computer(action: "screenshot")
mcp__claude-in-chrome__read_page(tabId) // accessibility tree
The architectural difference matters. Dev-browser writes one script that executes many actions, amortizing the startup cost. The Chrome extension requires Claude to interpret each tool response before deciding the next action, adding 3-20 seconds of "thinking time" between steps.
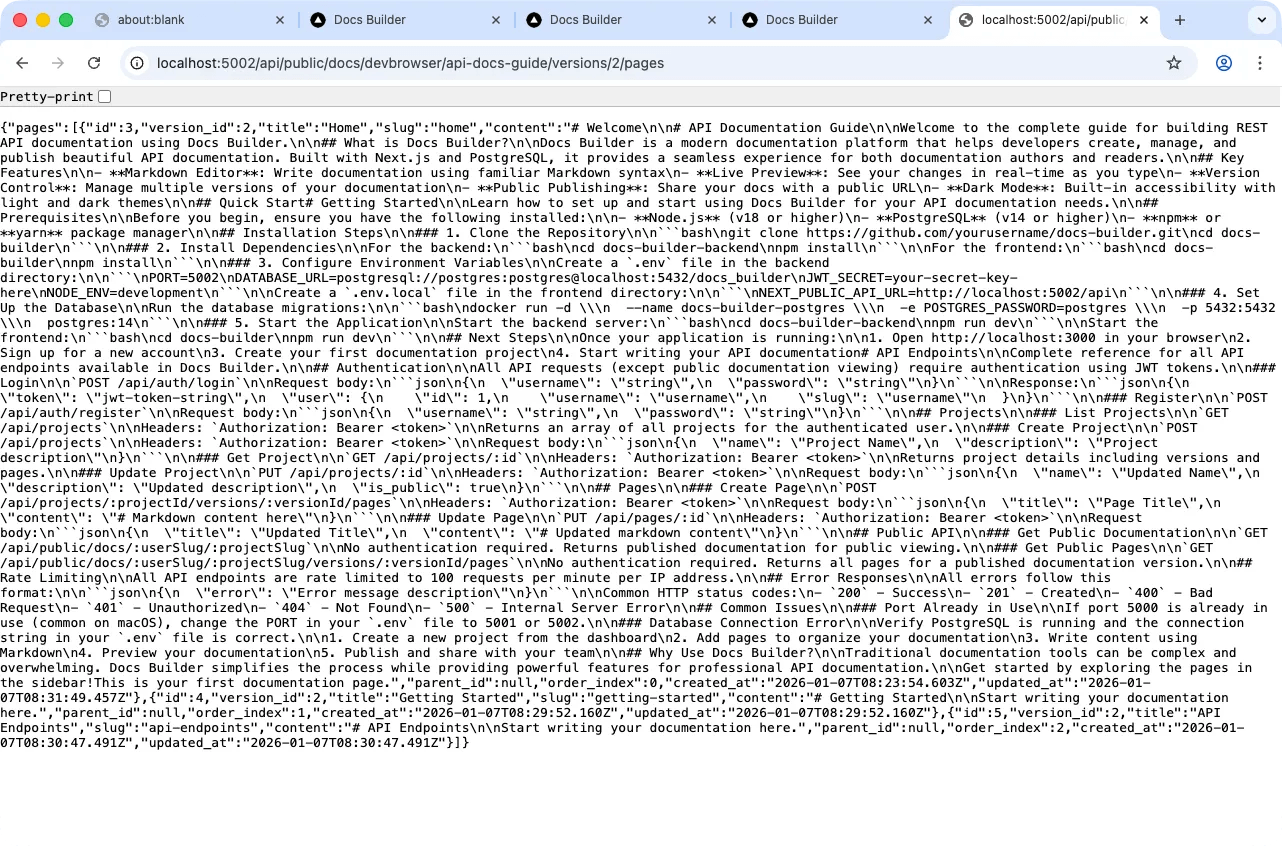
Dev-browser also has two advantages: screenshotting and LLM-friendly DOM snapshots. When Claude takes screenshots and reads DOM snapshots optimized for token usage, it more quickly pinpoints what needs modification.
Testing CSS injection speed
We tested how fast each tool could inject CSS and HTML into the running app without modifying code files.
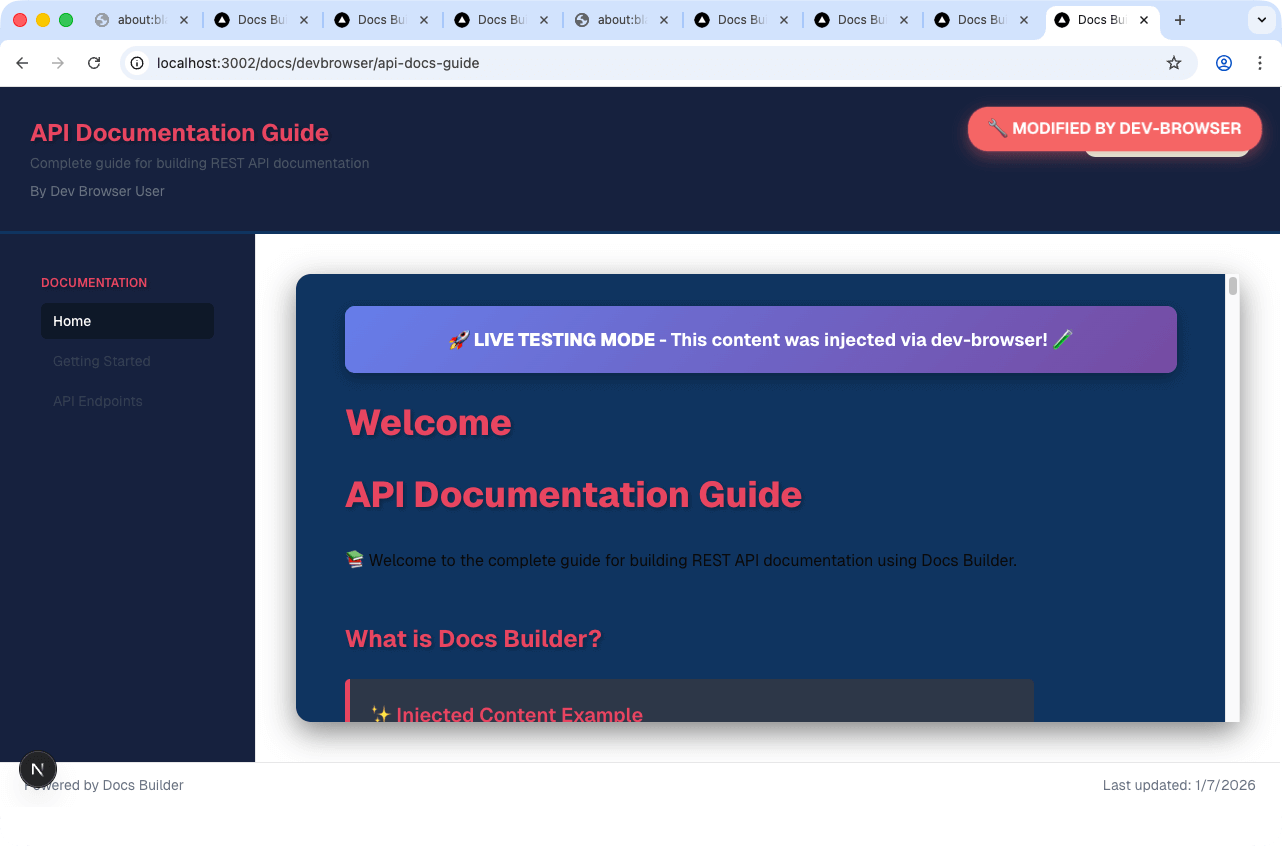
Dev-browser took 3 minutes 30 seconds and consumed 6.3k tokens.
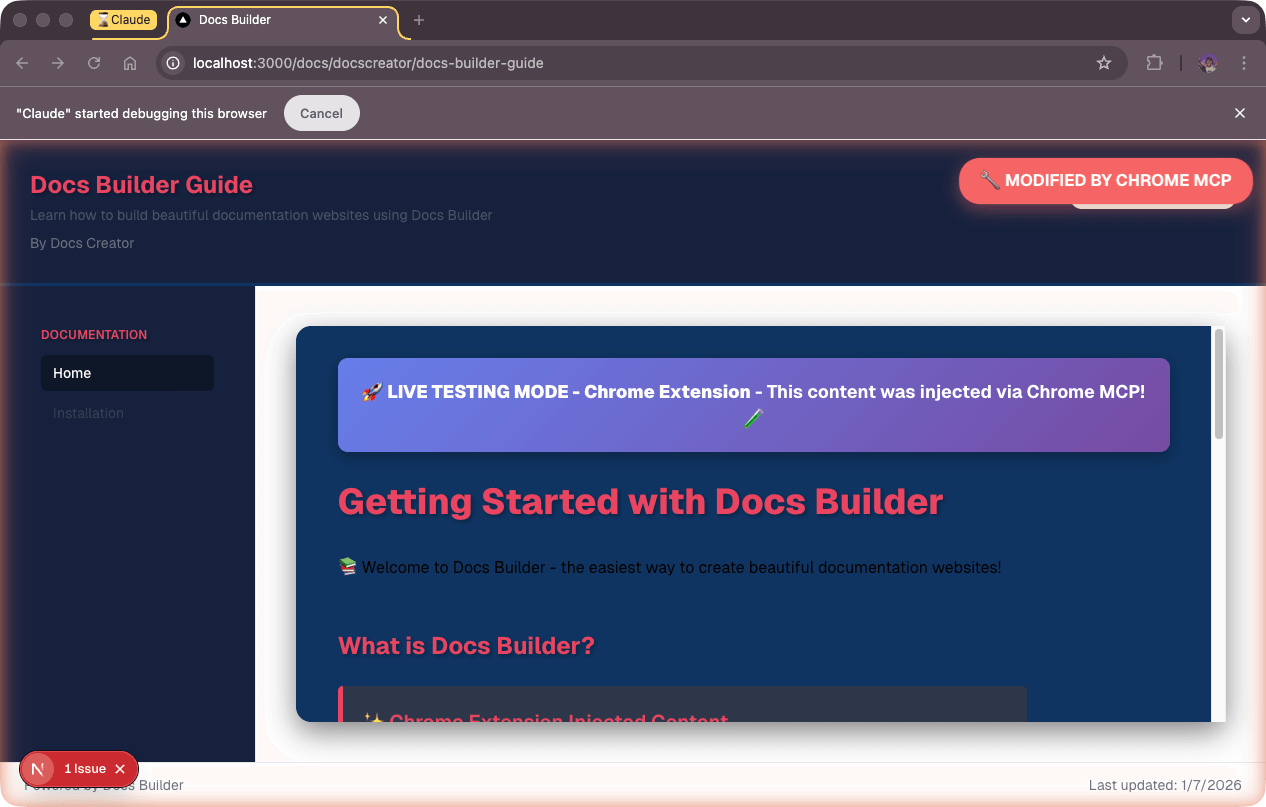
The Chrome extension took 3 minutes and consumed 4.6k tokens.
For this simple task, the Chrome extension was slightly faster and more token-efficient because the startup cost matters less with fewer actions.
The break-even point
The Chrome extension excels at small tasks (1-15 actions) where each tool call executes in approximately 200 milliseconds with near-zero startup overhead. Dev-browser requires 2-3 seconds for process spawning, compilation, and connection establishment before any action occurs.
Dev-browser's strength emerges in complex workflows (20+ actions). The startup cost is paid once per script, then actions execute at native browser speed without thinking time between steps.
Here's the same workflow as a dev-browser script:
npx tsx <<'EOF'
import { connect, waitForPageLoad } from "@/client.js";

const client = await connect();
const page = await client.page("docs-workflow");

// Step 1: Navigate to dashboard
await page.goto("http://localhost:3001");
await waitForPageLoad(page);

// Step 2: Login
await page.fill('input[type="email"]', 'test@example.com');
await page.fill('input[type="password"]', 'password123');
await page.click('button:has-text("Login")');
await waitForPageLoad(page);

// Step 3: Create new project
await page.click('text=New Project');
await page.fill('input[name="name"]', 'E2E Test Documentation');
await page.fill('textarea[name="description"]', 'Created via automation');
await page.click('button:has-text("Create")');
await waitForPageLoad(page);

// Step 4: Add first page
await page.click('text=+ New Page');
await page.fill('input[placeholder="Page Title"]', 'Getting Started');
await page.fill('textarea', '# Welcome\n\nThis is automated content.');
await page.waitForTimeout(1000); // Auto-save

// Step 5: Add second page
await page.click('text=+ New Page');
await page.fill('input[placeholder="Page Title"]', 'API Reference');
await page.fill('textarea', '## Endpoints\n\n- GET /api/docs\n- POST /api/docs');
await page.waitForTimeout(1000);

// Step 6: Add third page
await page.click('text=+ New Page');
await page.fill('input[placeholder="Page Title"]', 'Examples');
await page.fill('textarea', '```js\nconst docs = new DocsBuilder();\n```');
await page.waitForTimeout(1000);

// Step 7: Publish
await page.click('button:has-text("Publish")');
await page.waitForTimeout(500);

// Step 8: Get public URL
const publicUrl = await page.evaluate(() => {
  const urlElement = document.querySelector('.public-url');
  return urlElement?.textContent;
});
console.log('Published at:', publicUrl);

// Step 9: Navigate to public URL to verify
await page.goto(publicUrl);
await waitForPageLoad(page);

// Step 10: Verify all pages are visible
const pageLinks = await page.$$('aside button');
console.log(`Found ${pageLinks.length} pages in public view`);

// Step 11: Take screenshot of public docs
await page.screenshot({ path: 'tmp/published-docs.png' });

await client.disconnect();
console.log('✅ Complete workflow finished');
EOF
The same workflow using the Chrome extension:
1. navigate → http://localhost:3000 (~300ms)
2. form_input → email field (~200ms)
3. form_input → password field (~200ms)
4. computer(click) → Login button (~300ms)
5. computer(click) → New Project (~300ms)
6. form_input → project name (~200ms)
7. form_input → description (~200ms)
8. computer(click) → Create button (~300ms)
9. computer(click) → + New Page (~300ms)
10. form_input → page title (~200ms)
11. form_input → textarea content (~200ms)
... (continue for pages 2 & 3)
12. computer(click) → Publish (~300ms)
13. javascript_tool → extract URL (~200ms)
14. navigate → public URL (~300ms)
15. javascript_tool → count pages (~200ms)
16. computer(screenshot) → capture (~200ms)
Each tool call requires Claude to interpret the response before making the next call, consuming more tokens.
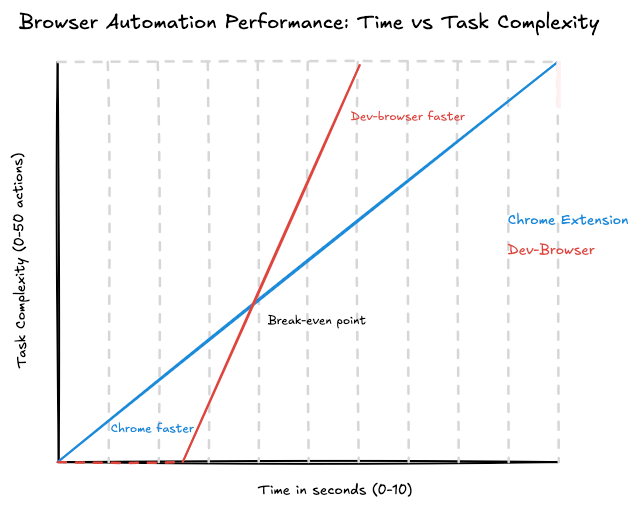
The graph below visualizes this performance difference. Chrome's linear execution (blue line) starts quickly but slows as tasks become more complex. Dev-browser's approach (red line) has a higher startup cost but scales better, with the break-even point occurring around 15-20 actions. Beyond this threshold, dev-browser's advantage grows exponentially.
Final thoughts
At Ritza, time matters. We write technical content, and we need Claude Code to test its work quickly. We recommend dev-browser for agentic browser testing and automation.
Our projects showcase client products with more complexity than to-do apps. Dev-browser excels at complex workflows, using 33% fewer tokens and finishing in half the time compared to the Chrome extension. For workflows with 20+ actions, the speed advantage reaches 16x.
The Chrome extension works well for quick validations under 15 actions. But for end-to-end testing and scenarios you'll run repeatedly, dev-browser's upfront script investment pays off immediately.