Dash0 vs Honeycomb vs New Relic
Choosing an observability platform means committing to how you'll debug production issues for years to come. Migration is costly, so the initial decision matters.
This comparison evaluates New Relic, Honeycomb, and Dash0 across installation complexity, feature sets, documentation quality, and pricing models. Each platform takes a different architectural approach: New Relic offers 700+ integrations and enterprise features, Honeycomb focuses on event-based debugging with high-cardinality data, and Dash0 builds natively on OpenTelemetry for Kubernetes environments.
You'll see how each platform handles Kubernetes setup, what daily usage actually feels like, and what you pay at different scales.
The App We're Monitoring
To test these platforms, you need an application that generates real telemetry data. A static website tells you nothing about how observability tools handle production complexity.
The test application is a shared grocery list running on Kubernetes. It generates the kinds of events that matter for observability: database queries, pod restarts, memory pressure, autoscaling events, and API traffic spikes. When the platform shows you a trace or an alert, you can verify it against actual application behavior.
This setup lets you evaluate how each platform handles Kubernetes integration, what its dashboards show during resource contention, and whether its alerts trigger when they should.
What You Need to Know
Observability platforms are difficult to migrate away from. Once you've built dashboards, configured alerts, and instrumented your applications, switching tools means rebuilding that infrastructure from scratch.
- Choose Honeycomb when you're a startup or small team handling high event volumes. The OpenTelemetry setup requires more manual configuration than New Relic or Dash0, but the event-based query model and BubbleUp feature make debugging distributed systems faster once you're running.
- Choose New Relic when you need to monitor infrastructure across multiple cloud providers and services. The guided installation takes longer than Dash0, but the 700+ integrations mean you rarely need to manually instrument. The free tier (100 GB/month permanently) makes it viable for teams that need enterprise features without an immediate budget.
- Choose Dash0 when you're running Kubernetes and want a fast setup with OpenTelemetry. Installation takes four commands via Helm. The integration catalog is smaller (50+ vs New Relic's 700+), but the OpenTelemetry-native approach means anything speaking OTLP works without vendor-specific agents. The AI service monitoring features make it relevant for teams adding LLM integrations to their products.
Installation and Setup
Each platform takes a different approach to Kubernetes integration: New Relic provides a guided wizard with extensive configuration options, Dash0 uses a Kubernetes operator for automated setup, and Honeycomb requires manual deployment of an OpenTelemetry collector.
New Relic
New Relic supports authentication via Google, GitHub, GitLab, Bitbucket, or email. After creating an account, you select a region (Europe or USA) and get redirected to a guided installation wizard with three deployment paths:
- Auto-discovery: Installs agents on Linux, Windows, Docker, Kubernetes, and macOS.
- APM: Supports seven languages (Java, .NET, PHP, Node.js, Ruby, Python, Go) with an auto-telemetry option for Kubernetes using Pixie.
- Fleet deployment: Integrates with Ansible, Chef, and Puppet.
For stacks not covered by the wizard, New Relic provides an integrations marketplace (Azure, Docker, MySQL) or manual installation via license key.
For this guide, we followed the Kubernetes installation to monitor the clusters from:
-
You create a key; otherwise, you use an existing one, depending on your goals.

-
You then configure the Kubernetes integration, where you can create a new cluster by choosing a name and configuring how your Kubernetes integration runs.

-
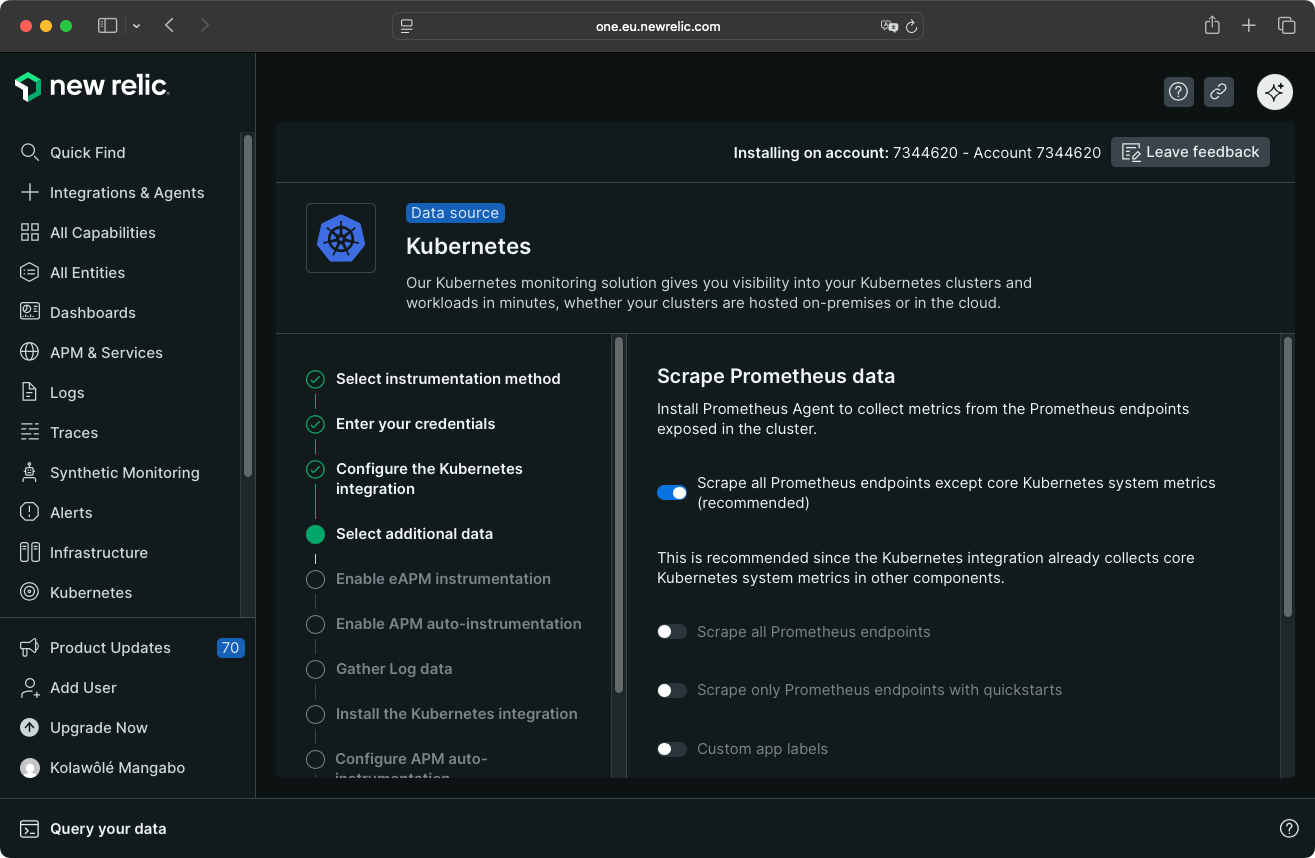
You can enable a Prometheus agent to collect metrics from Prometheus endpoints exposed in the cluster (optional).
-
You can enable eAPM administration. eAPM is a zero-instrumentation solution that automatically discovers all workloads within a Kubernetes cluster using eBPF (extended Berkeley Packet Filter) technology. eAPM is useful when you want complete Kubernetes observability without modifying application code or managing language-specific agents. (optional).
-
New Relic asks if you want to enable APM auto-instrumentation, which automatically monitors your applications running in the cluster.
-
You configure how log data is gathered. You can forward all logs with full enrichment or forward all logs with minimal enrichment.

-
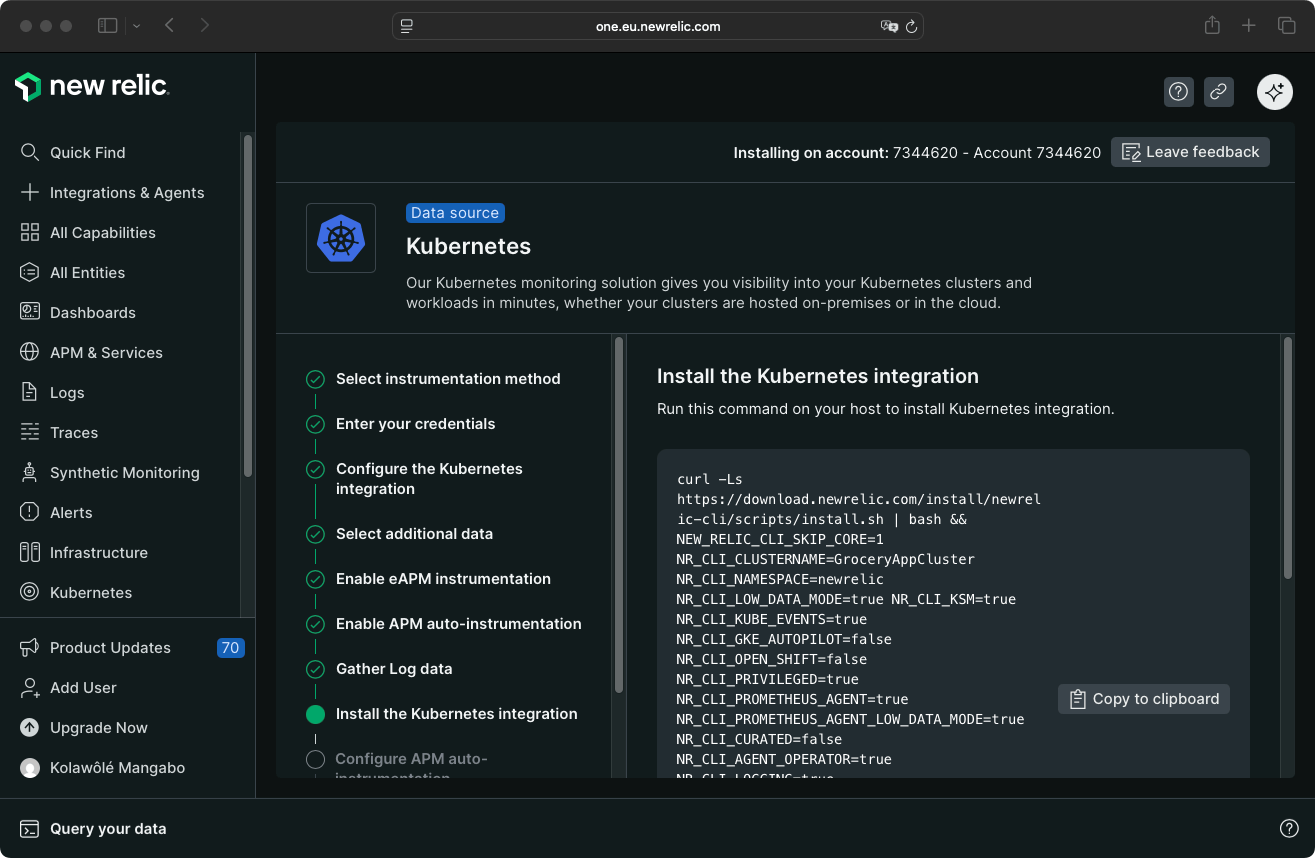
New Relic provides a command snippet to install the Kubernetes integration.
-
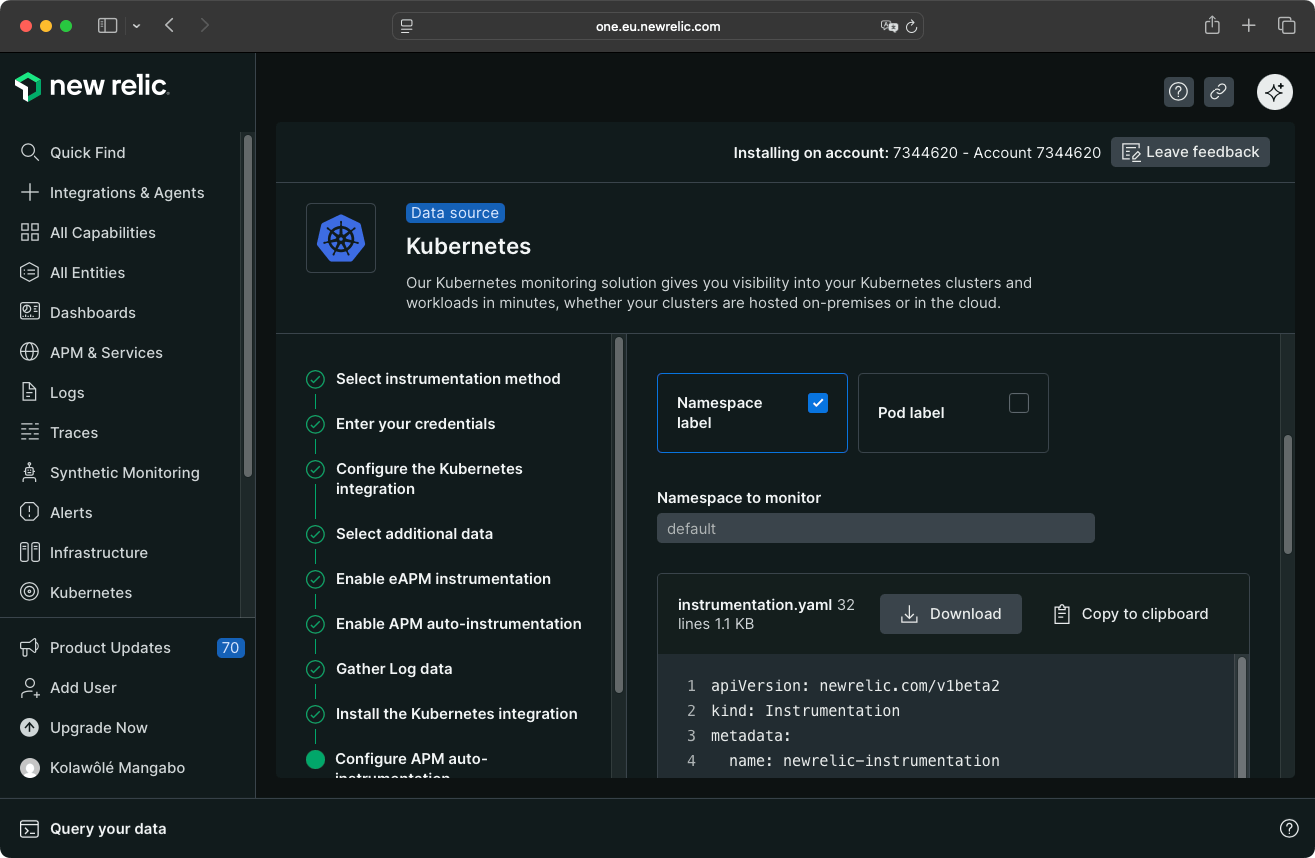
New Relic suggests configuring APM auto-instrumentation by providing a configuration file and the command to enable it.
-
You test the connection.
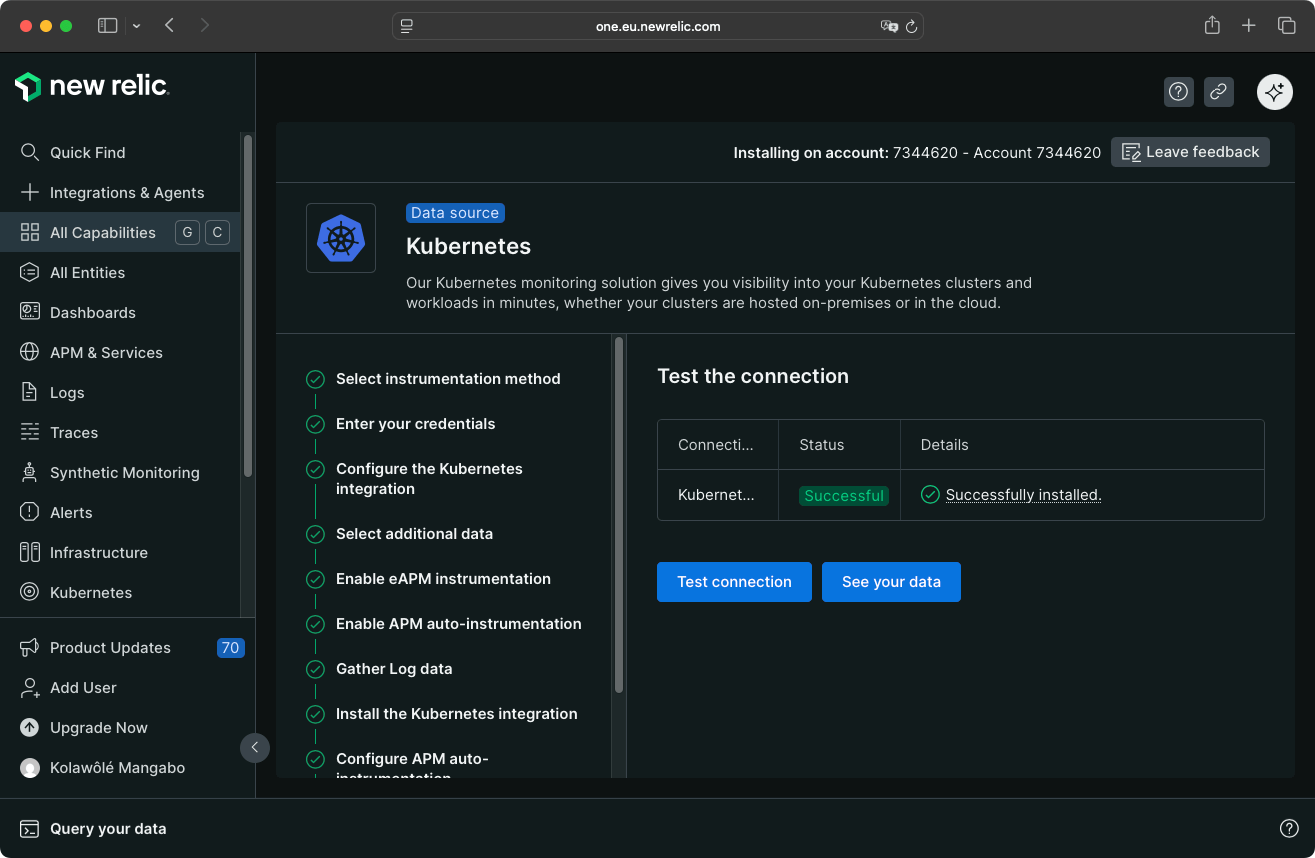
If the connection is successful, you access your Kubernetes application dashboard by clicking the See your data button.
Dash0
Dash0 supports authentication via Google, GitHub, or email. After login, you configure the organization name and data storage region.
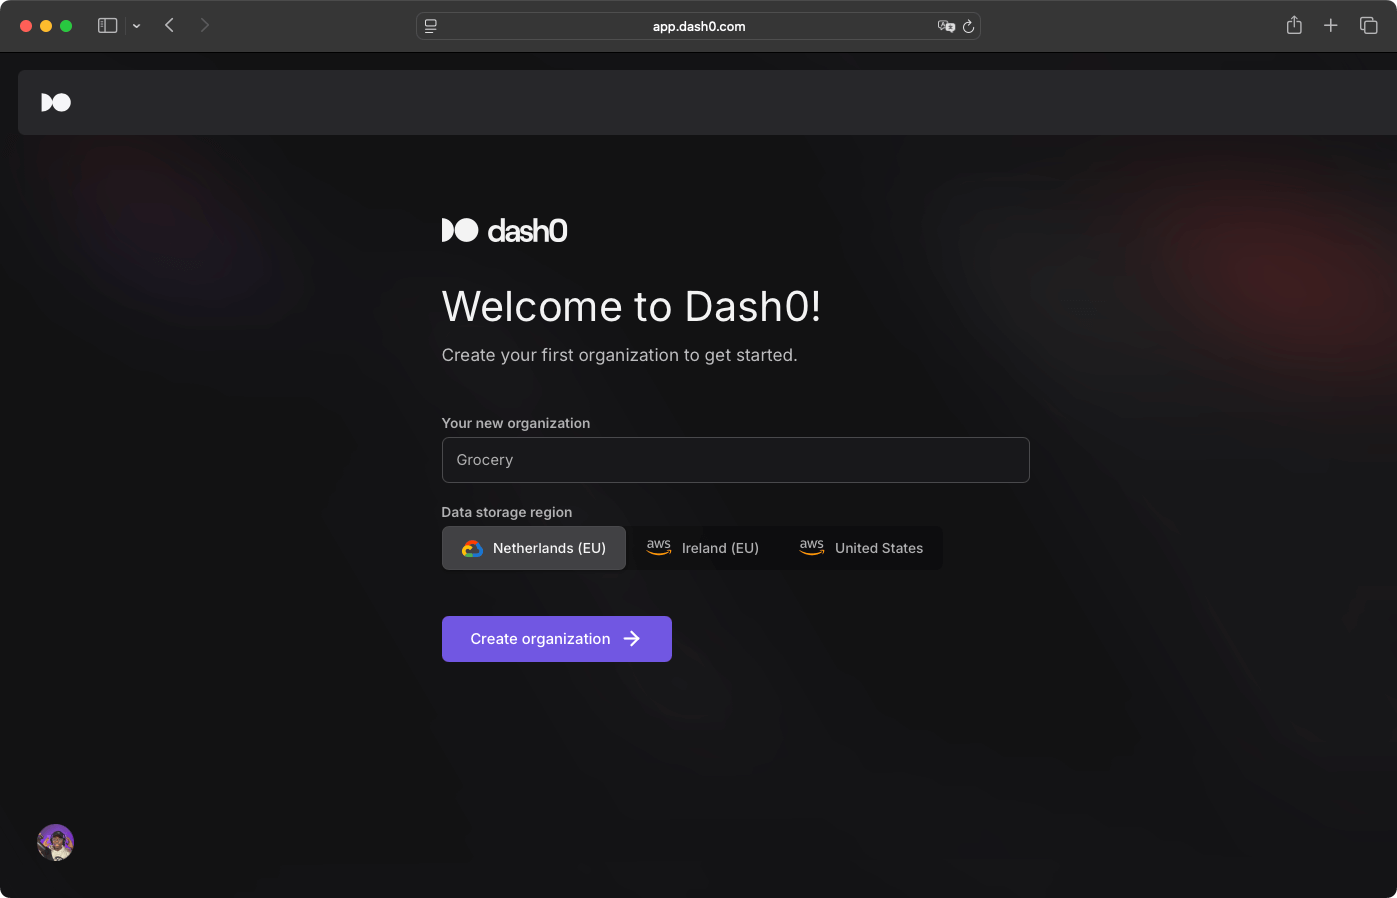
Dash0 provides an integrations catalog and a Kubernetes operator. The Dash0 Kubernetes operator is the fastest installation method for Kubernetes applications.

The setup page displays inline instructions with commands, structured like a mini tutorial:

The installation steps are straightforward:
- You install the Dash0 Helm dependency.
- You provide Dash0 with an authorization token.
- You deploy the operator via Helm chart.

You apply a Dash0Monitoring resource to enable monitoring for specific namespaces:
kubectl apply -n $NAMESPACE -f - <<EOF
apiVersion: operator.dash0.com/v1alpha1
kind: Dash0Monitoring
metadata:
  name: grocery-app
EOF
Once the installation completes, you're automatically redirected to your instance's dashboard.

Setup took approximately 5 minutes. The operator handles instrumentation automatically without modifying application code.
Honeycomb
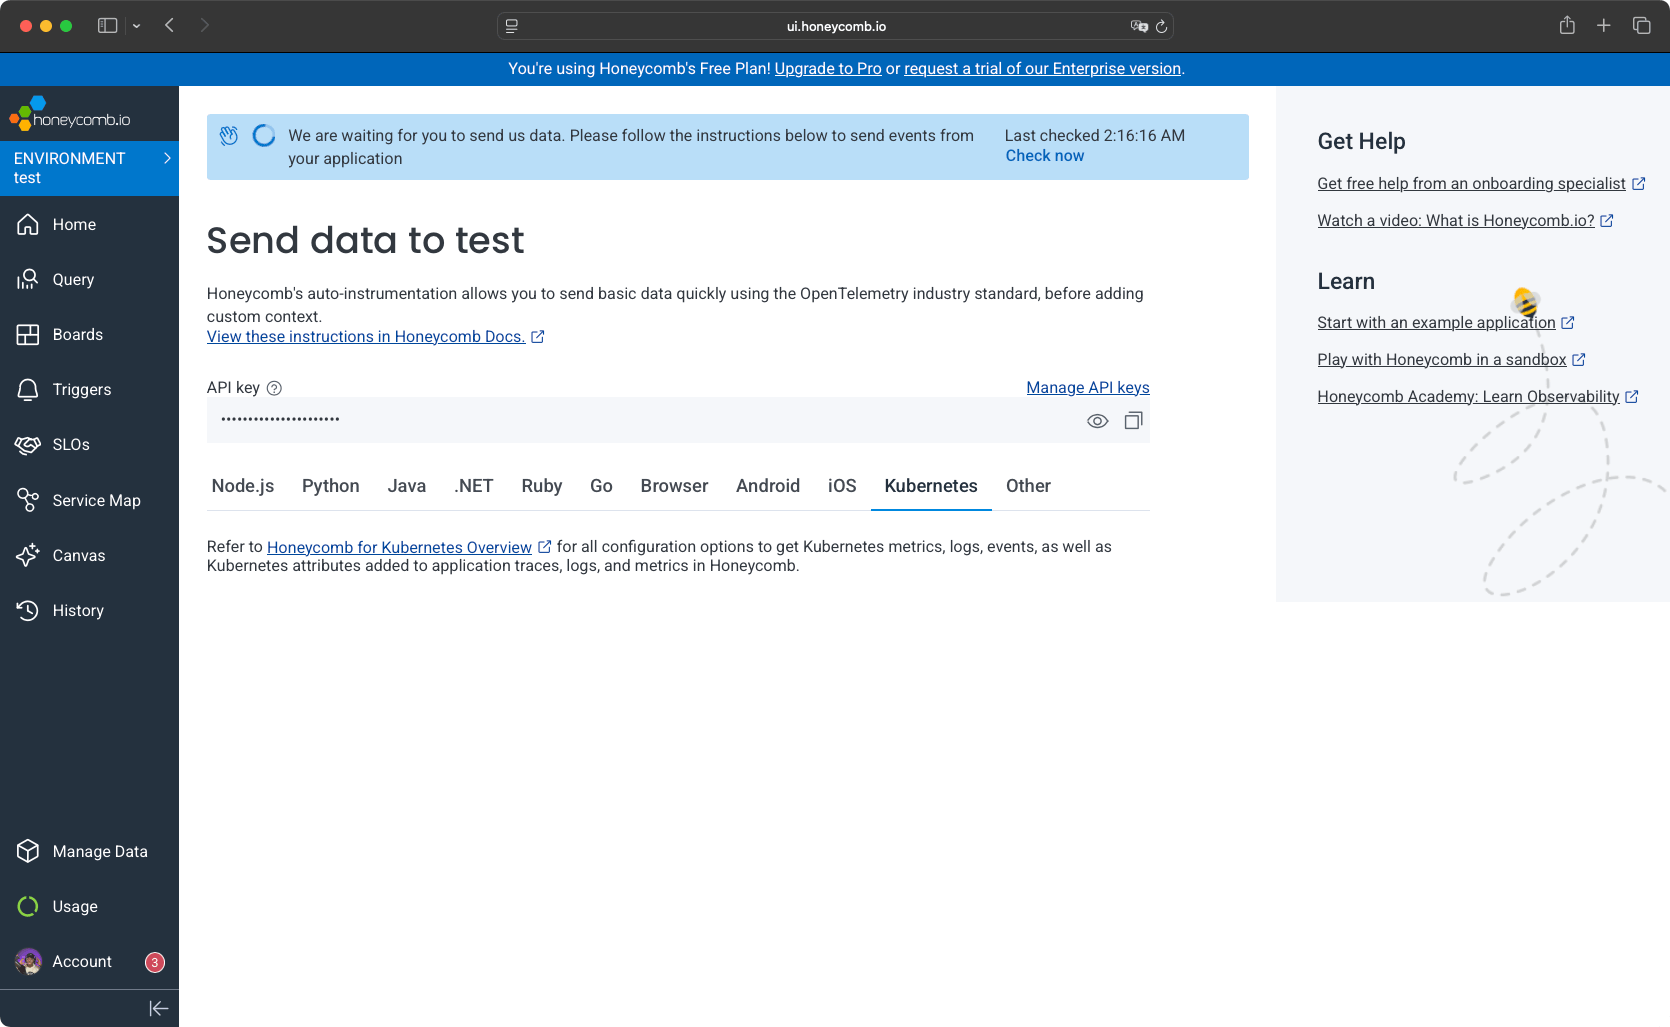
Honeycomb supports authentication via Google or email. After login, you configure telemetry endpoints manually using OpenTelemetry.
- You create a namespace and Kubernetes secret with your Honeycomb API key.
- You add the Helm repository for OpenTelemetry.
- You deploy a cluster-level collector (Deployment) that collects cluster-level metrics and Kubernetes events.
- You deploy a node-level collector (DaemonSet) that runs one pod per node, allowing application traces to be sent to the collector on the same node.
- You create a Service that provides a stable DNS name (
otel-collector-agent.honeycomb.svc.cluster.local) so applications can reach the collector without knowing pod IPs. - You verify collectors are running in the dashboard, as you will directly be redirected to the Home page with data displayed.
Setup requires understanding OpenTelemetry architecture. No guided UI wizard is provided. Setup took approximately 20 minutes, requiring documentation consultation for collector configuration values and OTLP endpoint setup.
Telemetry and Visualization
Each platform organizes telemetry data differently. New Relic groups data by entities, Dash0 separates signals into dedicated views, and Honeycomb centers on event queries.
New Relic
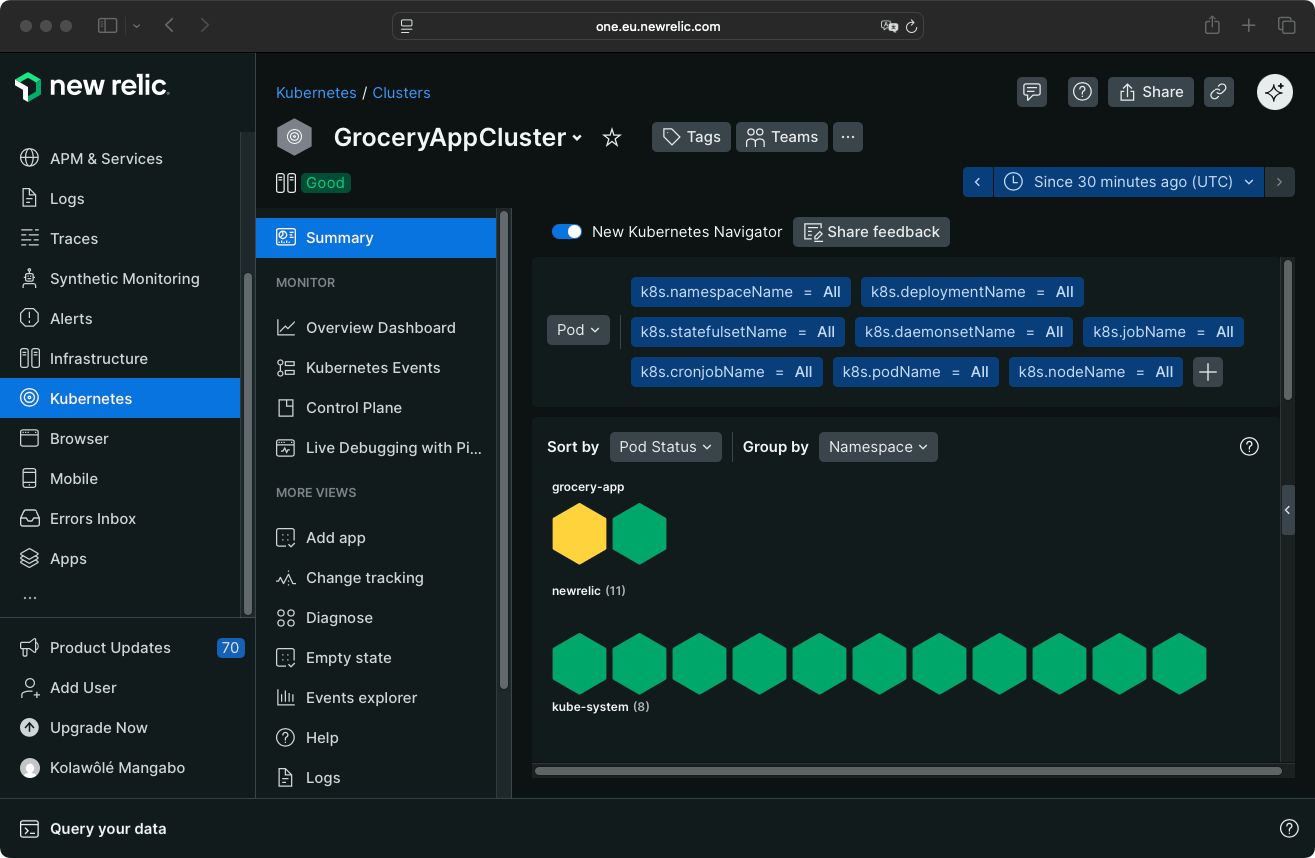
New Relic's entity-centric model organizes all monitored components in one place. New Relic displays all monitored components from your application: services, hosts, containers, mobile applications, browser applications, Kubernetes clusters, and log collectors.

Dashboard
New Relic suggests pre-built dashboards based on your installed agents. You can select an existing dashboard or create your own.
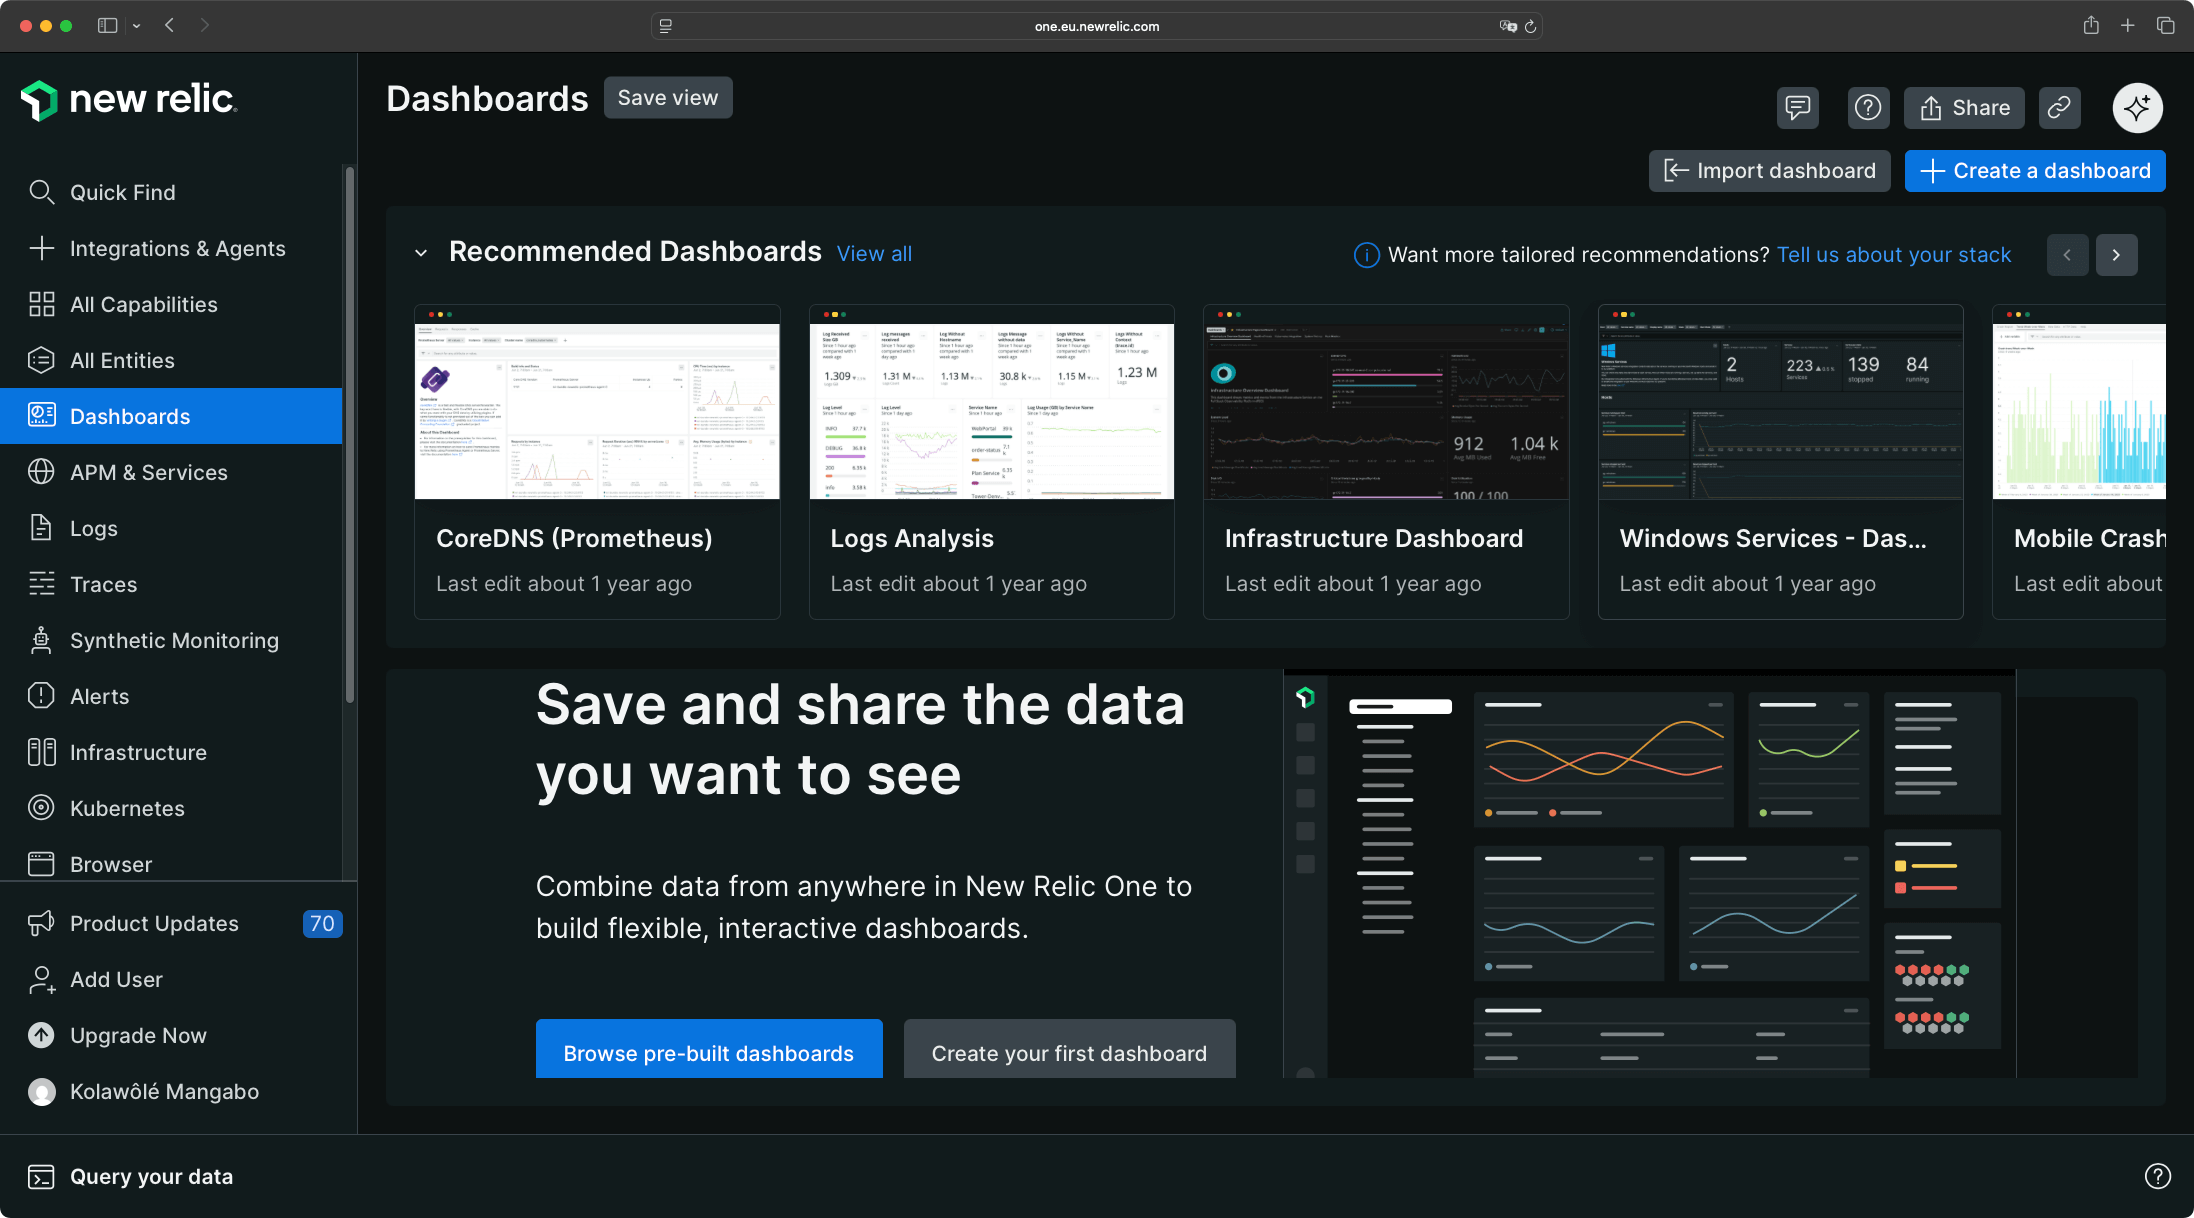
When selecting a pre-built dashboard, New Relic confirms agent installation and generates the dashboard immediately. For this comparison, we tested the Infrastructure dashboard, which populated in seconds.
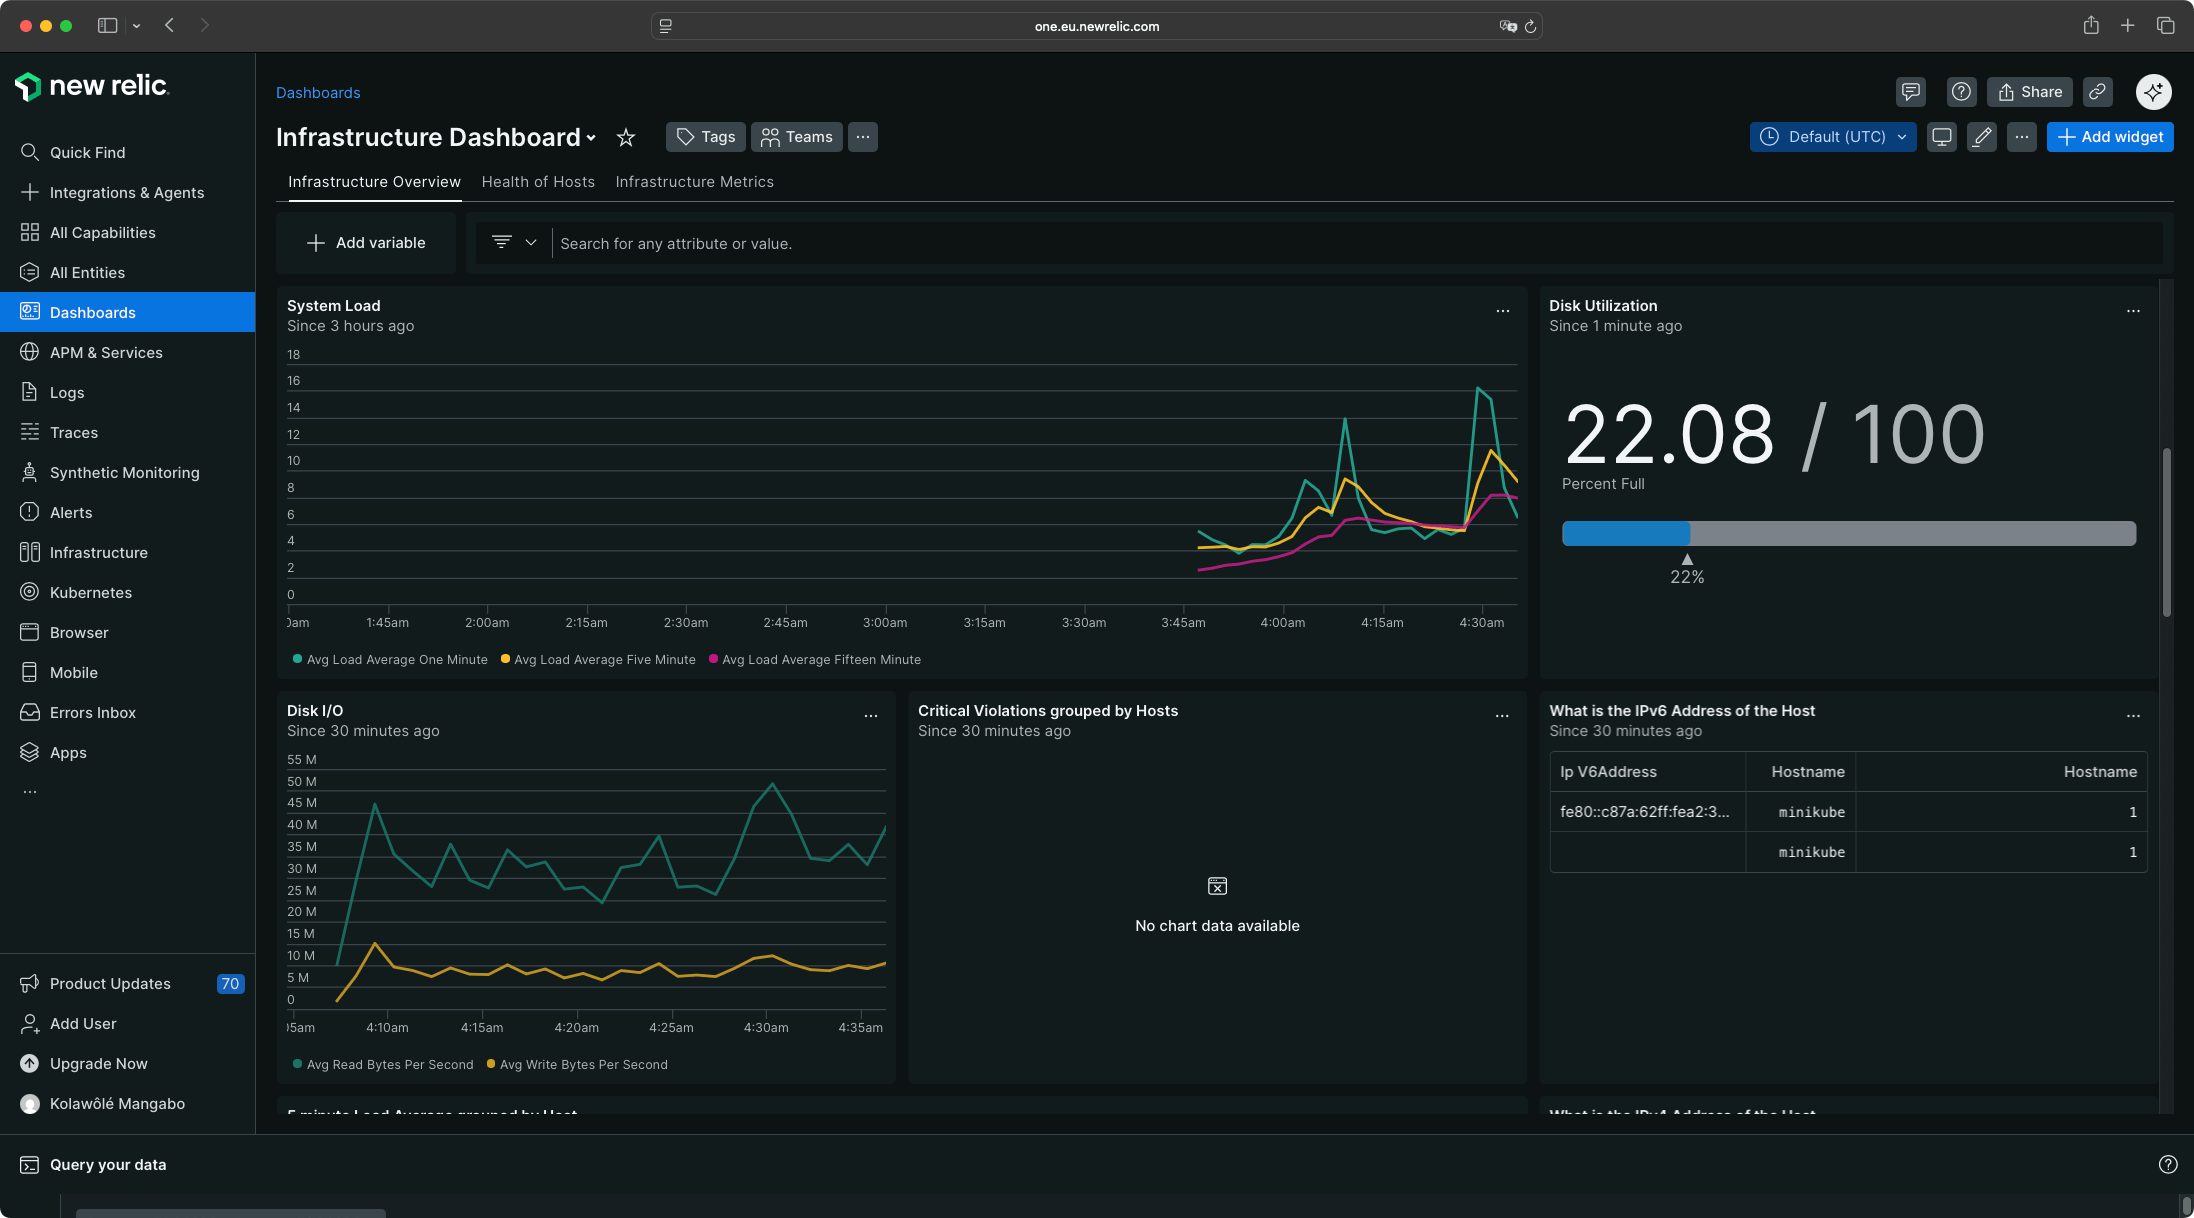
Infrastructure
The Infrastructure view provides a global system overview with host metrics, container status, and cluster health.

Dash0
Dash0 organizes telemetry into separate views for each signal type.
Telemetry
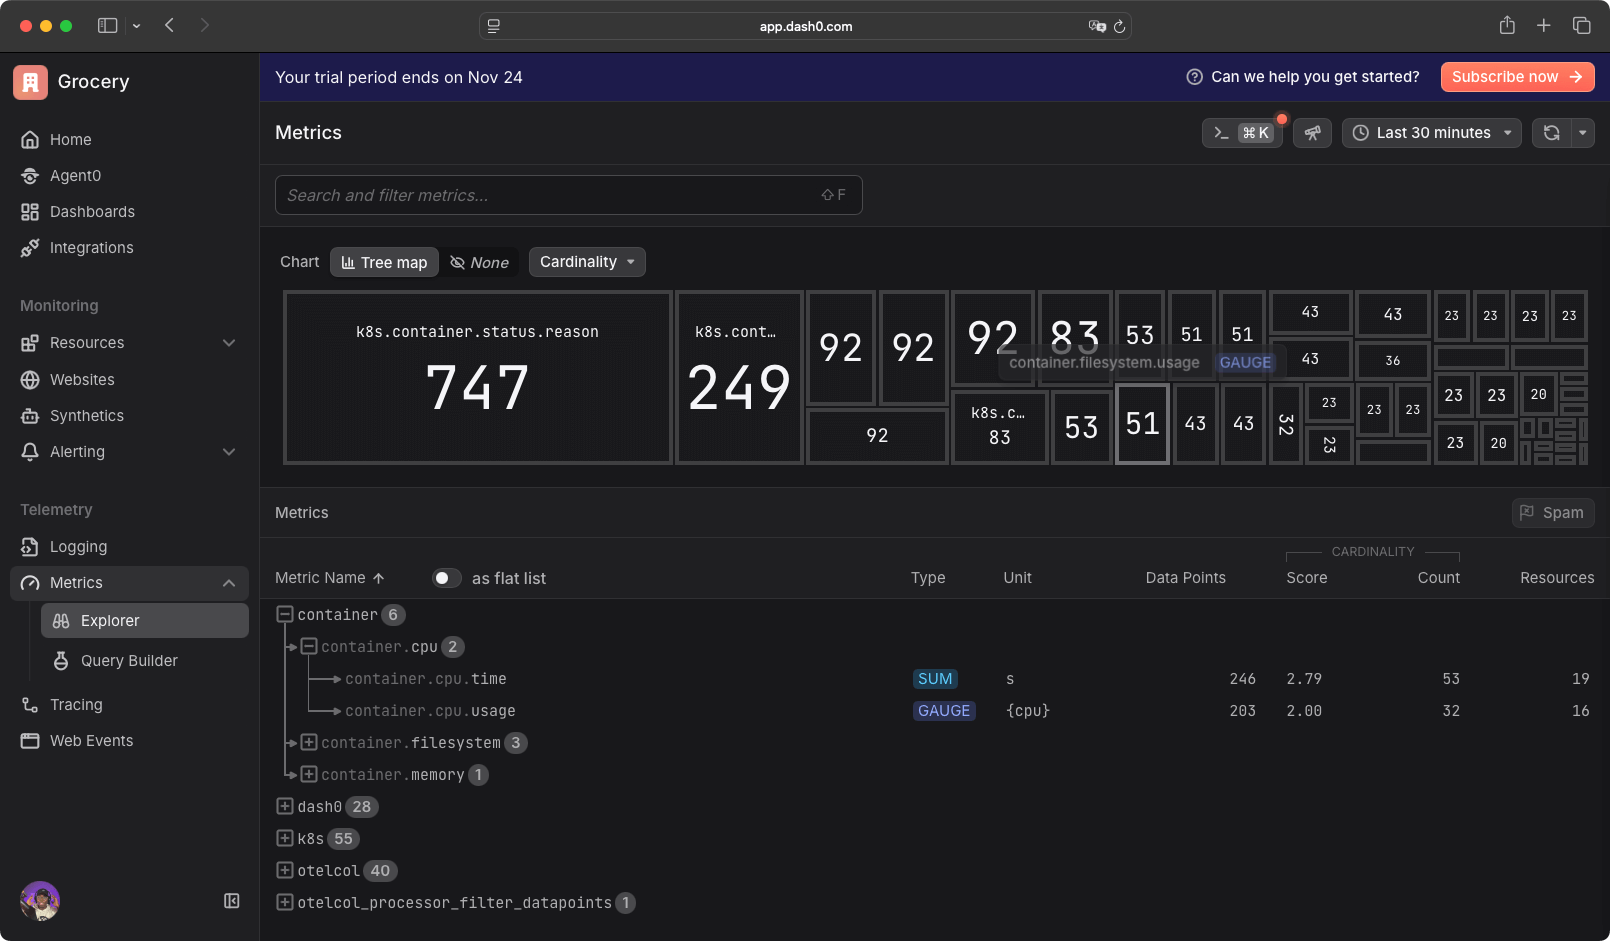
Dash0 supports logging, metrics, tracing, and web events. On the logging page, you have access to all recent logs refreshed every 2 seconds from your different pods and applications.

Dash0 provides filtering options including service name, service namespace, and resource name. The metrics page tracks a high volume of data points. You might need a bigger screen to visualize the metrics comfortably due to the number of tracked items.
On the tracing page, you choose the view or template for how you want to see the traces.
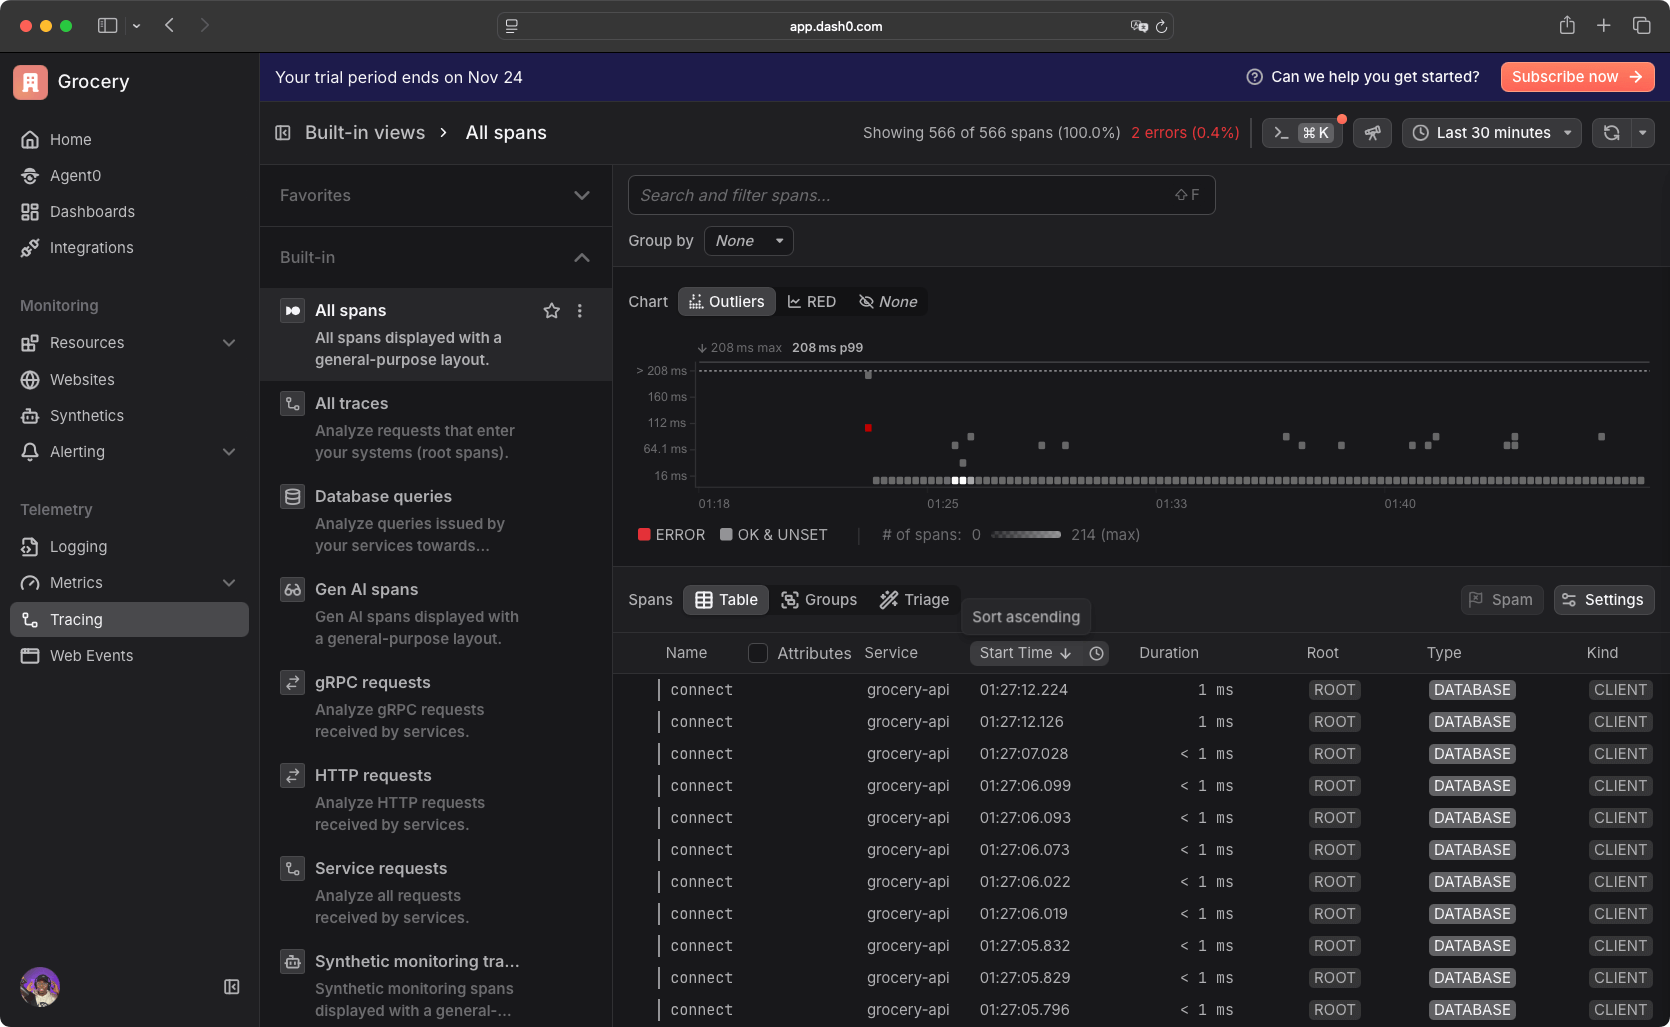
By default, Dash0 suggests built-in filters and dashboards where you can filter HTTP requests, service requests, database queries, all traces and spans, gRPC requests, and generative AI monitoring if you're monitoring AI services.
Honeycomb
Honeycomb centers on events and queries rather than pre-built entity views.
Instrumentation
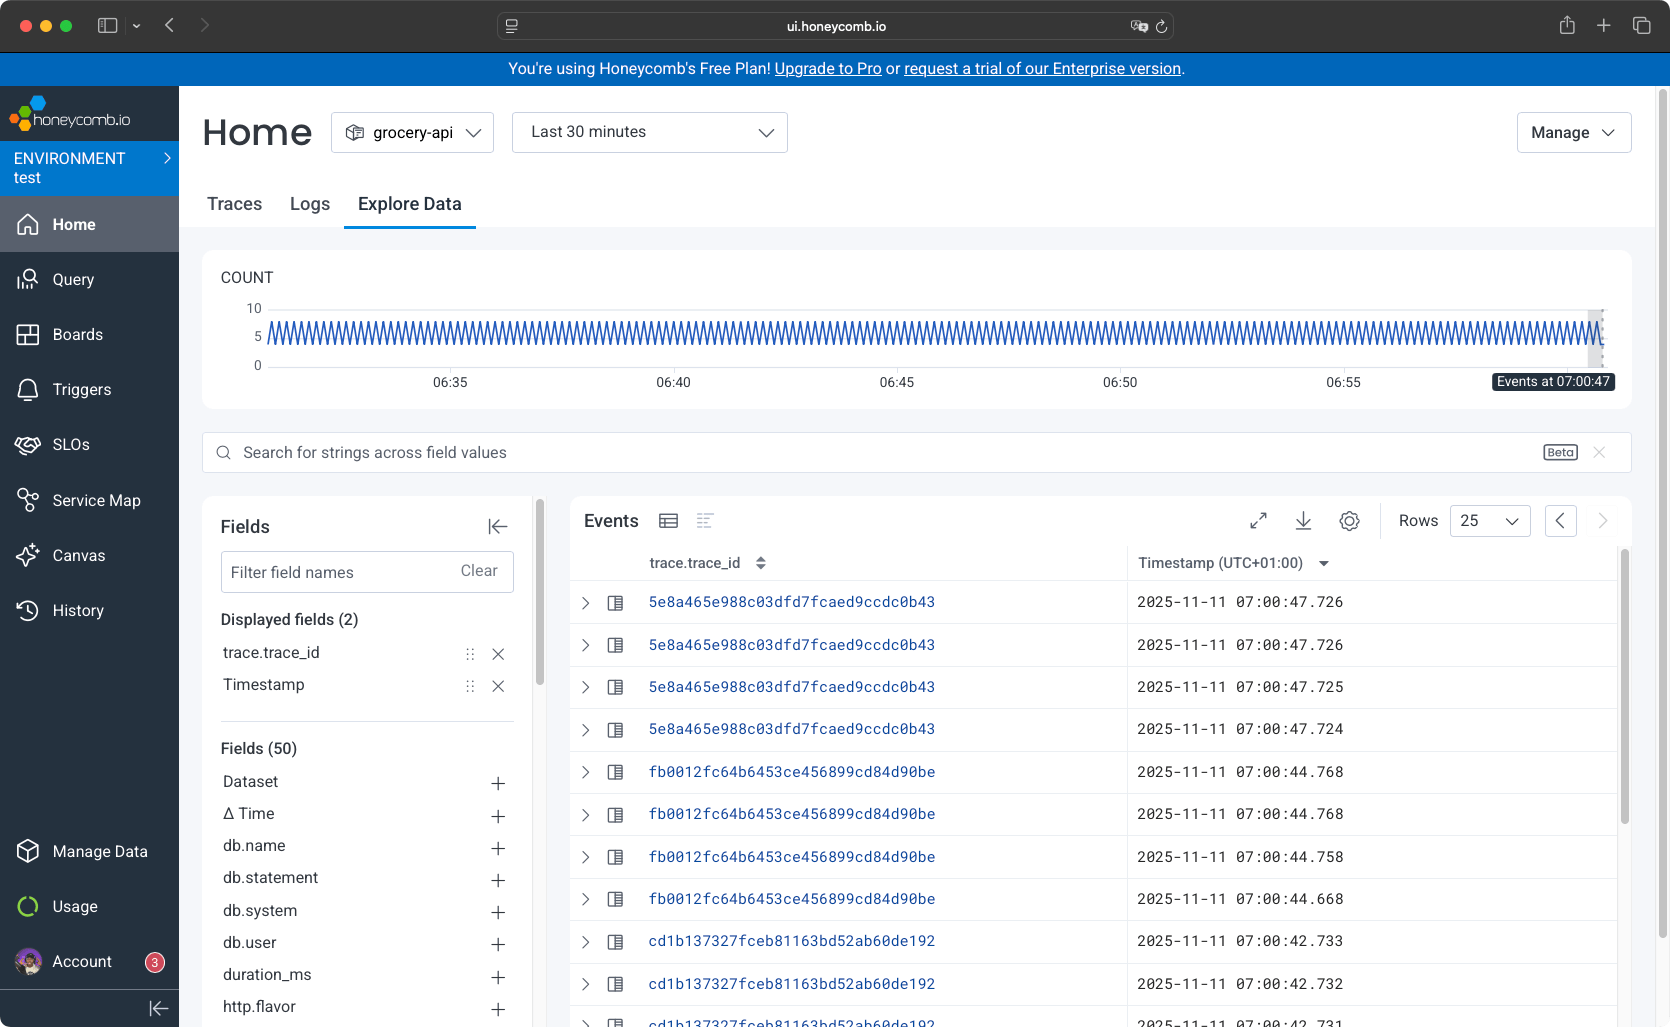
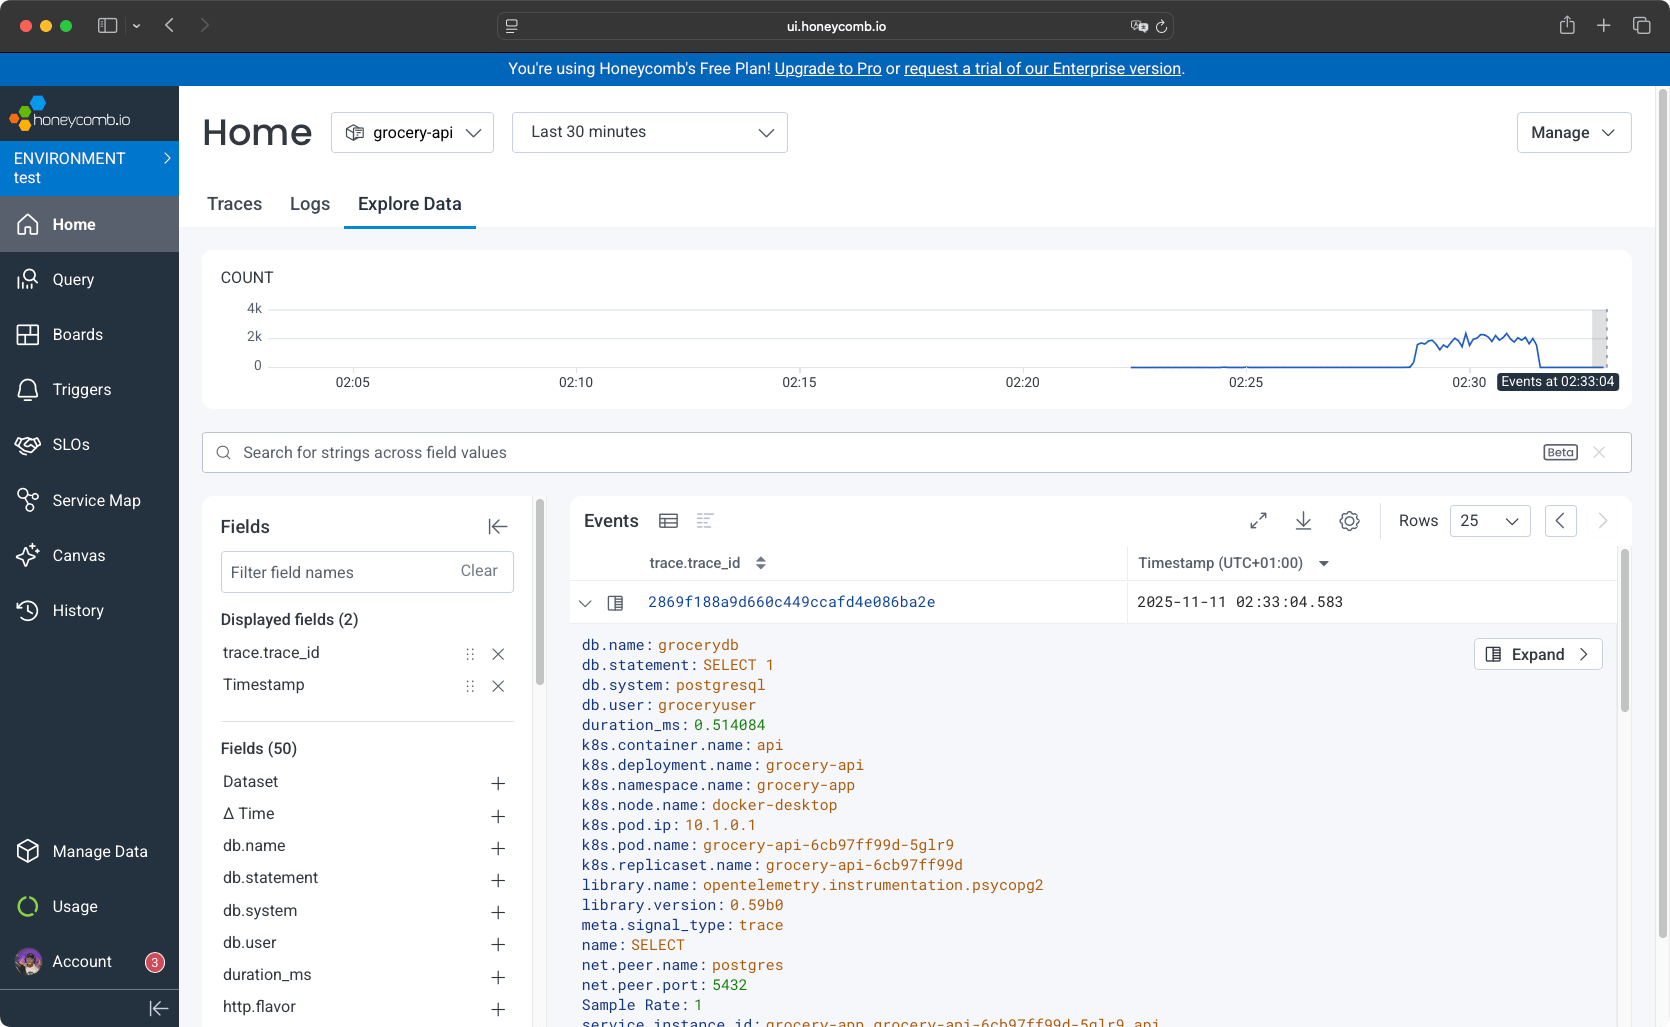
Honeycomb provides a home dashboard where you can see traces with trace volume, span volume, error volume, span duration, and total spans by type.
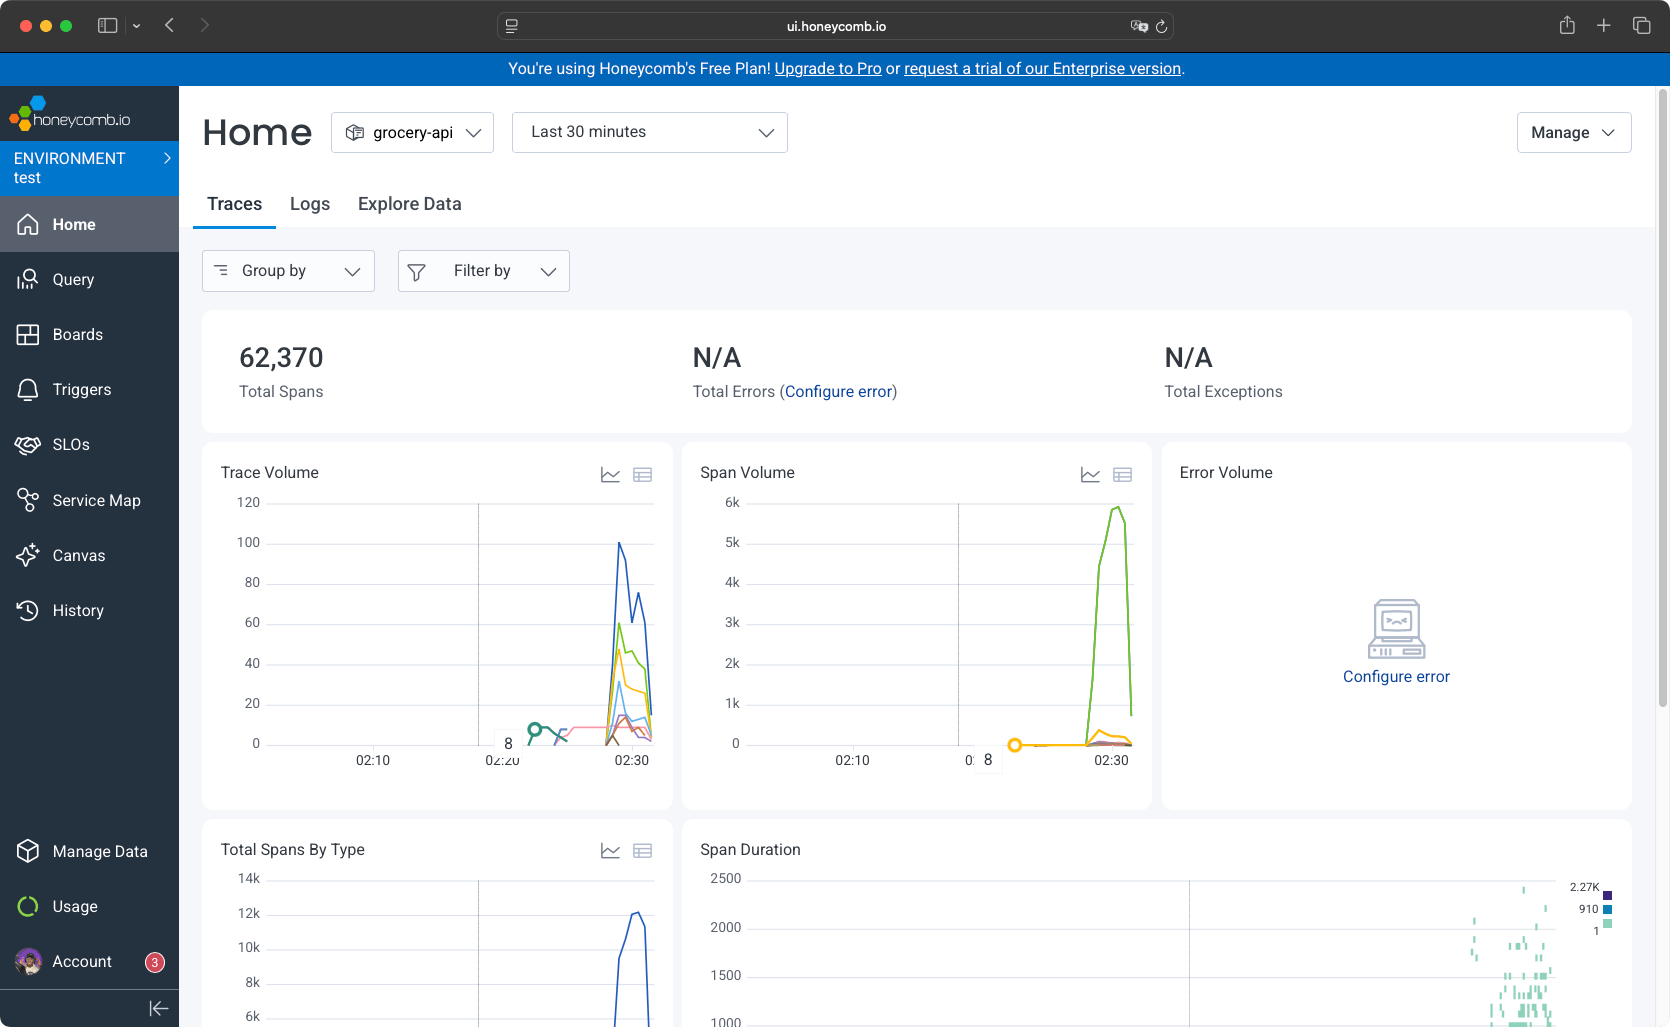
You have access to the logs table, where you can inspect the total number of logs, logs volume, top messages, and errors.
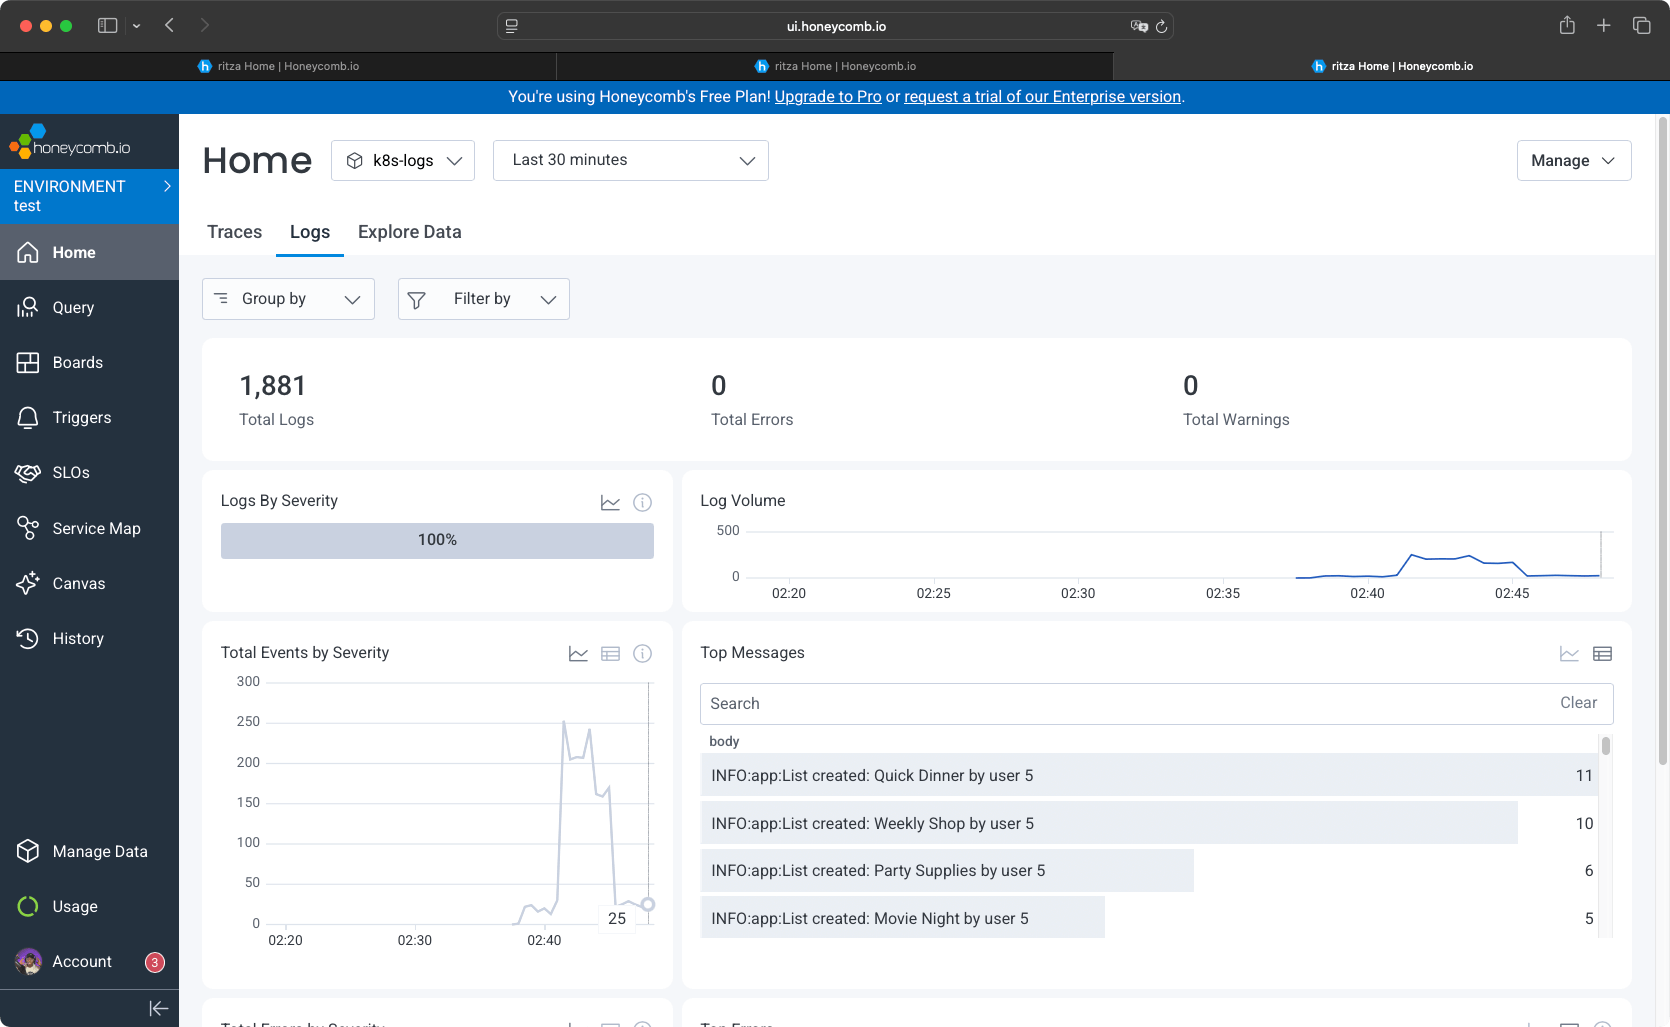
The explore data tab allows you to navigate through all events. You have filters that are auto-detected, along with information on events.
Queries
Querying your data is central to working with Honeycomb. When you want to retrieve specific events and analyze them, Honeycomb allows you to define queries. The platform provides a query assistant where you type a message prompt that generates the query for you. This differs from New Relic's pre-built dashboards and Dash0's template-based filters.

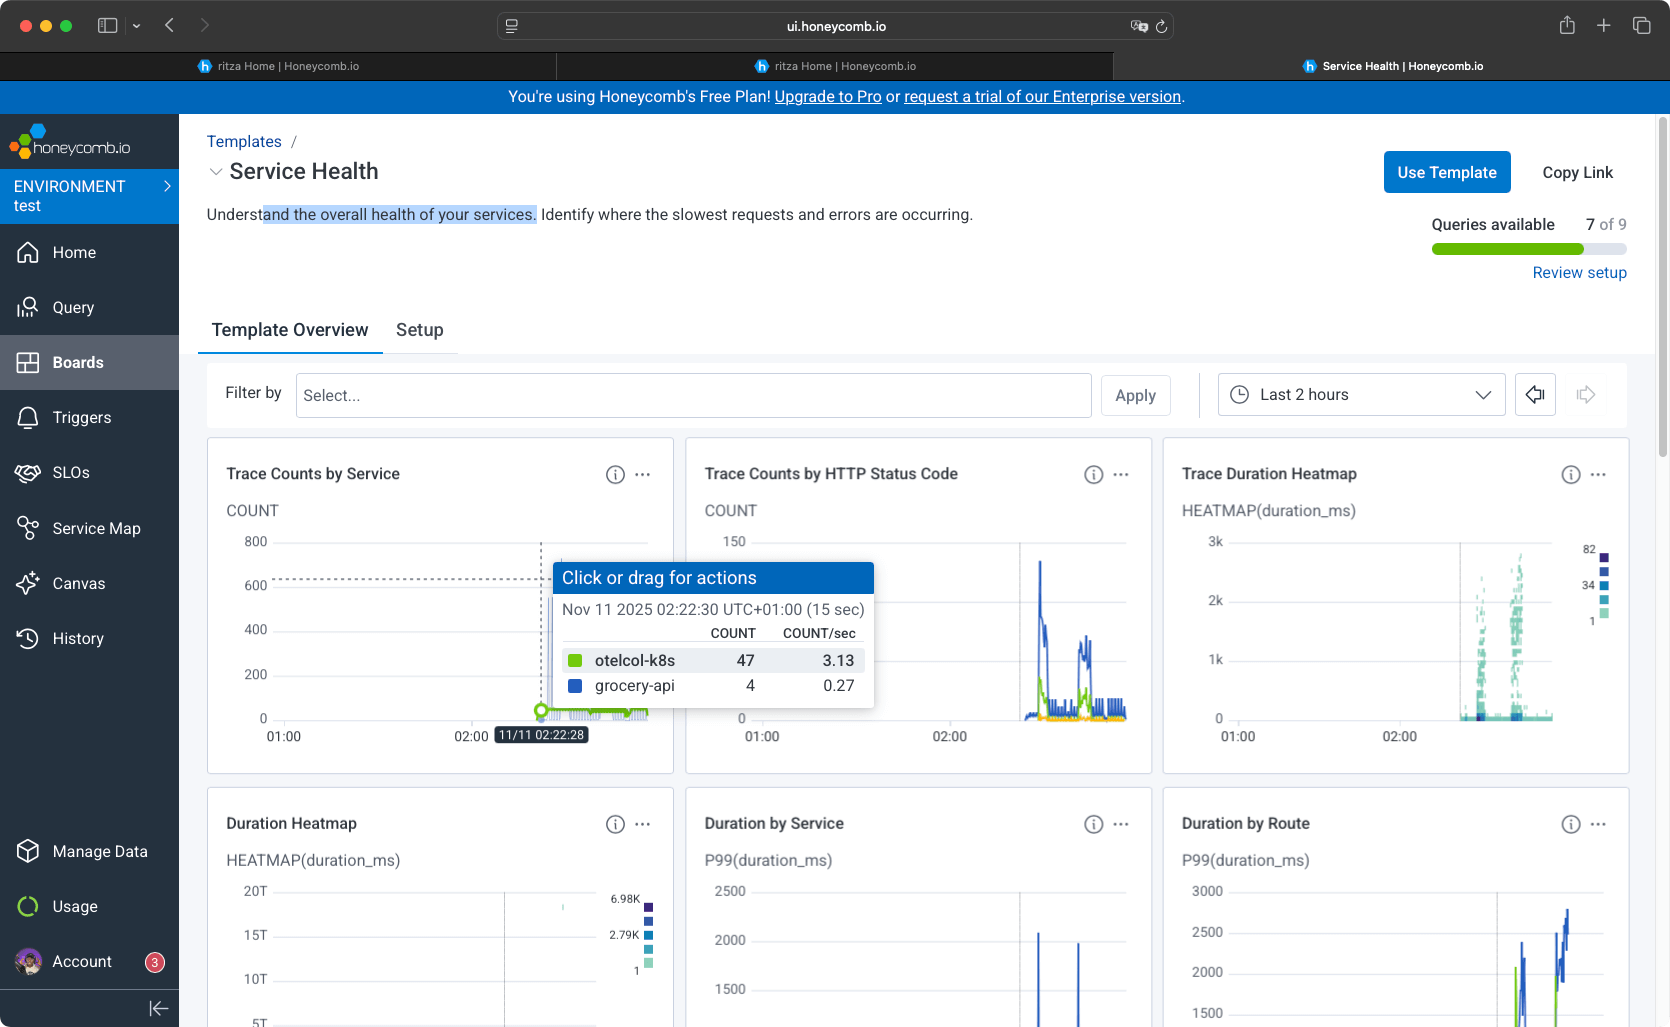
Dashboards
Honeycomb provides a dashboard feature where you can create custom dashboards. The platform includes templates for common use cases. For this comparison, we used the service health template to monitor service health.
Service Maps and SLOs
Honeycomb provides SLOs and service maps to help visualize your services and understand your architecture. Service maps visualize service architecture, identify service dependencies, and analyze the services involved in specific requests. The map is generated from distributed traces using Honeycomb's Environments and Services data model. Service-level objectives (SLOs) allow you to define and monitor service-level reliability over time.
Final thoughts
If you want comprehensive dashboards showing all system activity at once, New Relic or Dash0 provide that density. New Relic's pre-built dashboards populate instantly, while Dash0's template-based filters cover common patterns. If you prefer cleaner interfaces and query-driven investigation, Honeycomb's approach feels less cluttered but requires more active engagement to find issues.
Alerting and Notifications
All three platforms provide alerting capabilities, but they differ in notification channel options and workflow customization.
New Relic
New Relic allows you to set up alerts to get notified about resource usage spikes, issues, or errors.

You can create custom alerts or use pre-built alert conditions. The integration list for alerts is extensive.
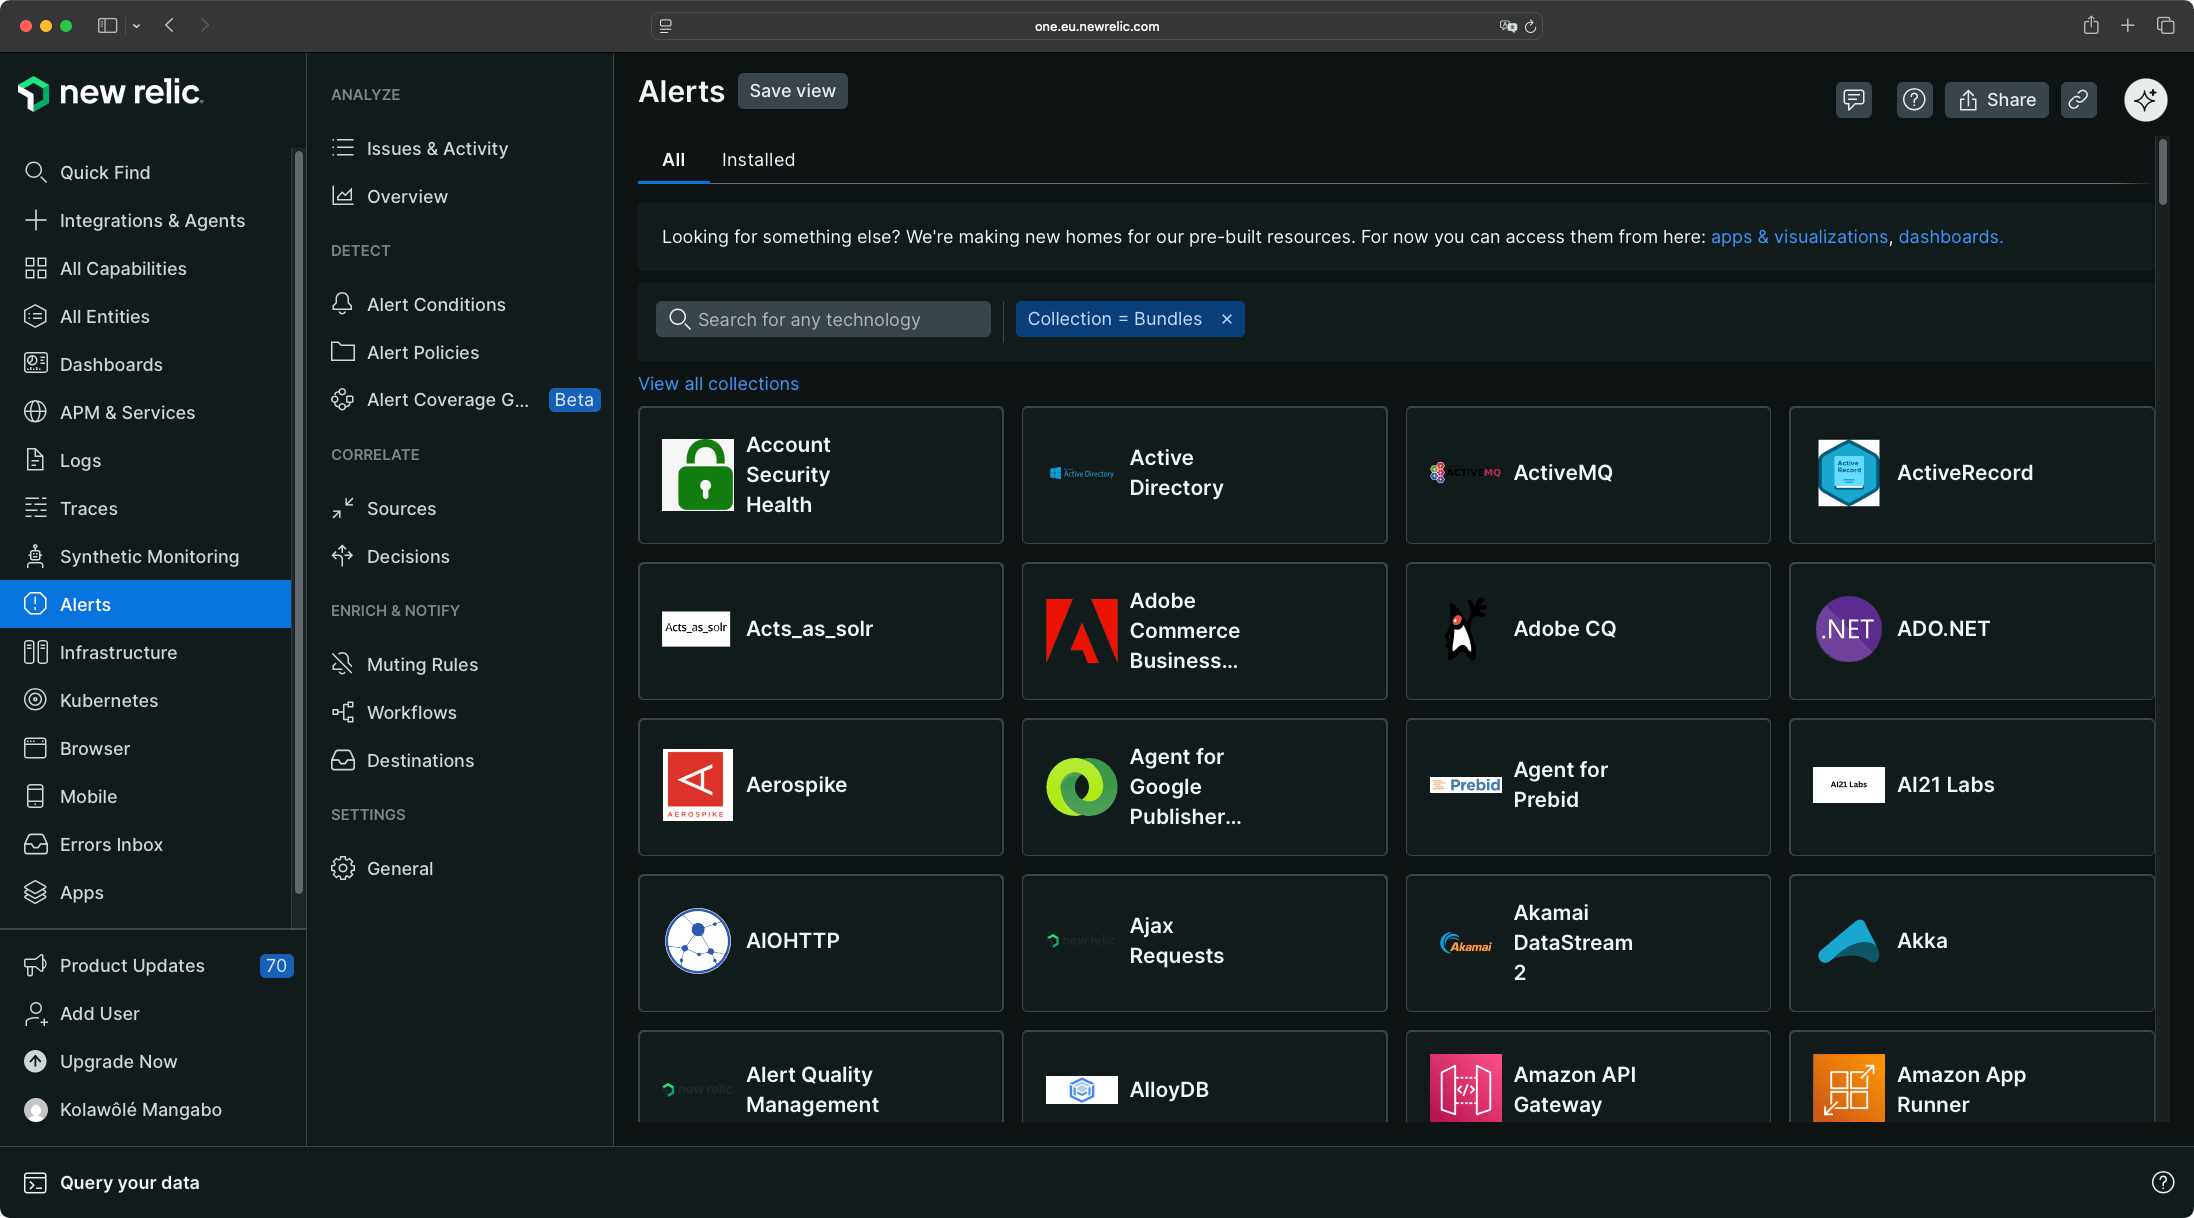
New Relic supports notifications via email, Slack, Webhook, Mobile push, PagerDuty, Jira, ServiceNow, and AWS EventBridge. You can create flexible workflows to automatically filter, enrich, and route alert data to specific destinations. You can add muting rules to suppress metrics or issues you don't want to track, which is useful when processing thousands of events per minute.
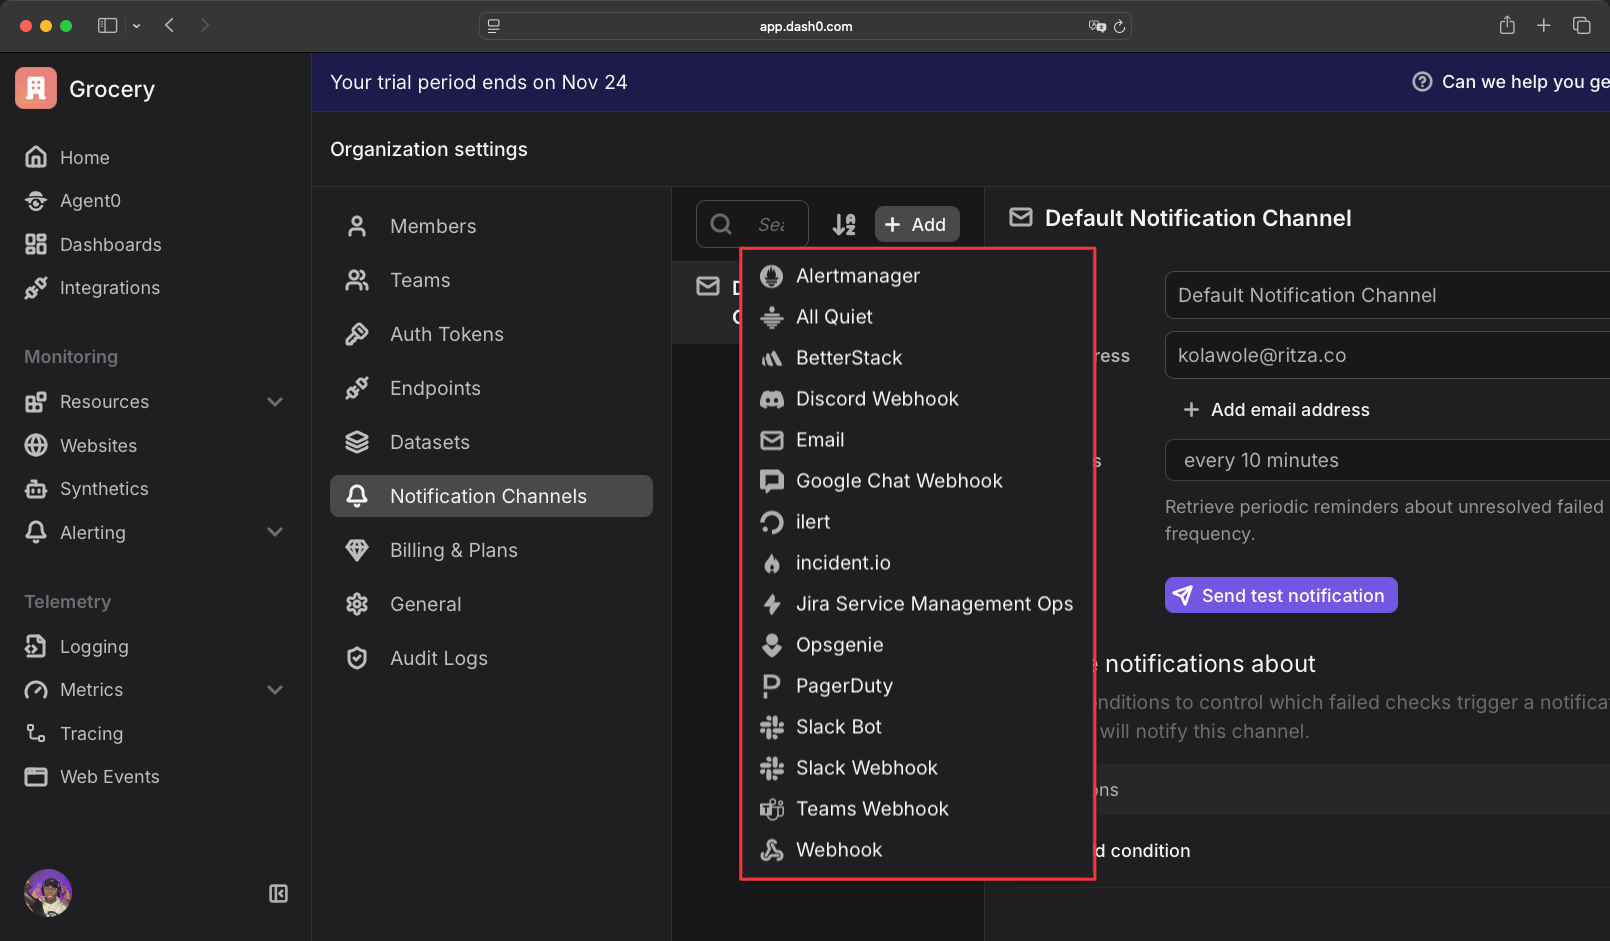
Dash0
Dash0 allows you to create alerts from templates or manually configure them for services, metrics, tracing, logging, or web events.
Dash0 supports these notification destinations: All Quiet, BetterStack, Discord, email, Google Chat, ilert, incident.io, Jira, Opsgenie, PagerDuty, Slack, Microsoft Teams, and webhooks for custom integrations.
Honeycomb
Honeycomb provides alerts that you can configure using existing templates or create your own.
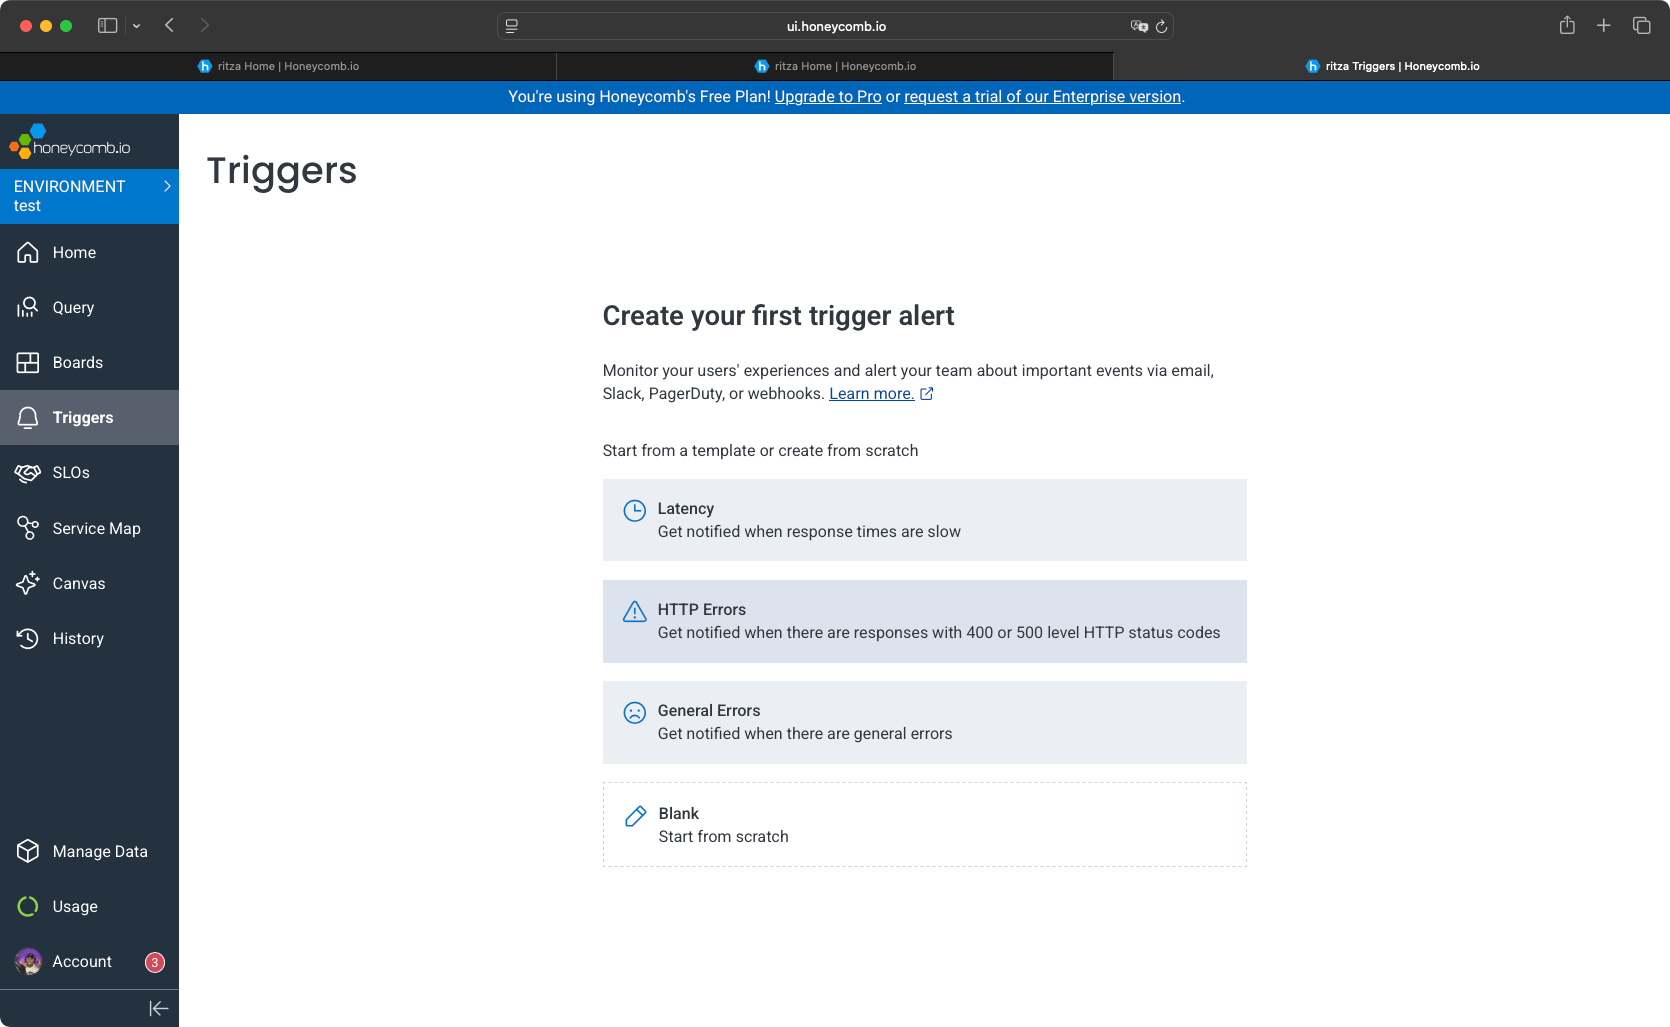
Honeycomb supports notification channels including Slack, GitHub App, and custom triggers for PagerDuty or webhooks. This is fewer options than New Relic and Dash0.
Final thoughts
If you need the widest range of notification destinations, Dash0 supports the most modern incident management and collaboration tools. If you need enterprise integrations and advanced alert routing with workflow automation, New Relic provides that sophistication. If your team uses Slack and PagerDuty, Honeycomb's options cover those essentials.
All three platforms support webhook-based alerting, which is helpful if you want to build custom notification workflows.
Developer Experience and Documentation
Developer experience varies significantly across these platforms. New Relic provides guided wizards, Dash0 emphasizes concise setup steps, and Honeycomb requires understanding its event-based model.
New Relic
The developer experience on New Relic is good. You're guided through detailed instructions for setting up the application. For an observability product, three things are essential:
- How easy the dashboard is to navigate.
- How easy you can create dashboards.
- How easy you can set up the observability tools: New Relic suggests code snippets at essential steps, you copy and paste them.
New Relic provides more than 700 integrations, so the need for manual setup is rare.
Dash0
Dash0 has enough integrations to help you work with, but not as many as New Relic, where you can integrate with a long list of cloud providers and tools. New Relic has more than 700 integrations, while Dash0 has 50+.
If you understand OpenTelemetry, you won't have issues working with Dash0.
Dash0's documentation is easier to navigate than the others. The integration steps are smaller and more direct. The Dash0 Kubernetes operator installation took four steps, which is half the configuration steps required for New Relic. However, Dash0's documentation lacks resources for deep maintenance or use cases.
Honeycomb
The setup may be complicated because you need to navigate multiple pages, from the dashboard app to the documentation page to others, which makes it feel longer.
When it comes to UI intuitiveness, Honeycomb's interface is clean. The focused feature set and limited integrations make the platform straightforward and easy to pick up for new developers adding telemetry to their applications.
Dash0 and New Relic can feel overwhelming on this point, as you're presented with many options and possibilities, but they provide what you might need as your applications grow.
Honeycomb's documentation is straightforward and interactive. However, unlike Dash0 and New Relic, there is an initial learning curve for users new to observability concepts, though onboarding can be eased through comprehensive documentation and tutorials.
Pricing
Pricing models differ significantly across these platforms. New Relic charges per GB and per user, Dash0 charges per telemetry signal count, and Honeycomb charges per event volume.
New Relic
New Relic's pricing is flexible with pay-as-you-go data charges. The platform has four pricing tiers:
- Free: 100 GB/month of data ingest, one full platform user, and unlimited basic/core users with access to all 50+ capabilities–no credit card required.
- Standard: Up to 5 full platform users at $10 for the first user and $99 for each additional user, plus $0.40/GB for data beyond 100 GB. Includes ticketed support with 2 business days response SLA and SAML SSO.
- Pro: Unlimited full platform users at $349/user (annual) or $418.80/user (monthly), plus $0.40/GB for data beyond 100 GB. Includes 2-hour critical support response and optional full consumption pricing (pay only for data and compute usage, no user fees).
- Enterprise: Custom pricing with everything in Pro plus FedRAMP/HIPAA eligibility, 1-hour critical support response, and priority routing. Also offers optional full consumption pricing.
All tiers charge $0.40/GB for data beyond the free 100 GB. Pro and Enterprise offer optional full consumption pricing with no per-user fees.
Dash0
As of February 2025, Dash0 charges purely consumption-based: $0.20 per million metric data points, $0.60 per million spans, and $0.60 per million log records.
You pay for the actual telemetry signals you send. No per-user fees, no per-GB charges, no minimum. If you send no telemetry in a month, you pay $0.
This differs from New Relic in several ways. Dash0 charges per signal count (logs, spans, metrics) rather than data volume in GB. You get unlimited users with no additional fees. There's no base subscription fee, and you can have true zero-dollar months if you send nothing.
Dash0 offers a 14-day free trial, but no permanent free tier.
Honeycomb
Honeycomb uses event-based pricing with three tiers.
-
Free: You get 20 million events per month with basic query history, trace viewing, the BubbleUp tool, two triggers, and community Slack support. The free tier includes features that were previously paid for, like searching historical activity and creating triggers.
-
Pro: Starting at $100 for 100 million events per month. You can scale up to 1.5 billion events per month. This tier includes unlimited triggers, single sign-on (SSO), up to 100 SLOs, and email/chat support with next-business-day response.
-
Enterprise: Custom pricing with a base allowance of 10 billion events per year. You get 100+ SLOs, secure tenancy, service maps, API access, dedicated customer success, and extended onboarding with a two-hour support response time.
Free Tier Comparison
New Relic has the most generous free tier with 100 GB/month and access to all platform capabilities. Honeycomb provides 20 million events/month free. Dash0 offers a 14-day trial, but there is no permanent free tier.
Conclusion
Choosing an observability tool can seem daunting at first, as it can be challenging to go back. Once you've built dashboards, configured alerts, and trained your team on query syntax, switching tools means rebuilding that investment. All of these tools do the job.
Here is a table summarizing the differences.
| Category | New Relic | Dash0 | Honeycomb |
|---|---|---|---|
| Fast Setup (under 10 min) | ❌ (~15 min) | ✅ (~5 min) | ❌ (~20 min) |
| Low Learning Curve | ✅ | ✅ | ❌ |
| Extensive Integration | ✅ (700+) | ❌ (50+) | ❌ |
| Generous Free Tier | ✅ (100 GB/month) | ❌ (14-day trial) | ✅ (20M events/month) |
| Predictable Pricing | ⚠️ (GB + users) | ✅ (per signal) | ✅ (per event) |
| Easy Documentation Navigation | ❌ | ✅ | ❌ |
| Instant Dashboards | ✅ | ✅ | ✅ |
| Beginner Friendly UI | ⚠️ | ⚠️ | ✅ |
| Most Alert Channels | ❌ (8) | ✅ (13) | ❌ (4) |
| Advanced Query Capabilities | ✅ | ✅ | ✅ |
| Kubernetes-Native | ✅ | ✅ | ✅ |
| No Manual Instrumentation | ✅ | ✅ | ✅ |
You can try the demo app from the grocery-sharing-app repository. The repository has branches with the setup for each service:
dash0new-relichoneycomb
The deployment script is ready to run:
./deploy-k8s.sh
This creates the grocery-app namespace, deploys PostgreSQL, the API, the frontend, and load generators, and sets up autoscaling. Within 60 seconds, you'll see pods scaling under load. Install Dash0, New Relic, or Honeycomb and compare your experience.